Download

1 / 37
380 likes | 613 Views
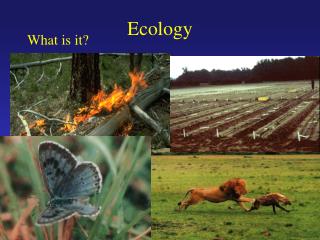
Ecology. Chapter 50. Biotic Factors Abiotic Factors. Chapter 50. Subfields of ecology Population : studies interactions between individuals of a population Ex? Community : studies interactions between individuals of different populations Ex?

E N D
Chapter 50 • Biotic Factors • Abiotic Factors
Chapter 50 • Subfields of ecology • Population: studies interactions between individuals of a population • Ex? • Community: studies interactions between individuals of different populations • Ex? • Ecosystem: studies interactions between the community and abiotic factors • Ex?
Chapter 52 • Exponential growth model • N= • Population size • B= • Birth rate… number of births per population size (per capita) • D (sometimes called M)= • Mortality rate.. Number of deaths per population size • r = rate of increase (growth rate) • Per capita birth – per capita mortality • Equation for exponential growth • dN/dt = rmaxN
Notice: r is constant, but population size curve gets steeper as N changes = J-shaped curve • Characteristic of: • Some organisms in a new environment • N reduced by catastrophe, now recovering
Carrying Capacity (K) • As the population grows, at some point resources become limiting • K= max. population size the environment can sustain • Not fixed, changes with resource availability
Allee effect • In the logistic model, an assumption is that each individual added has the same negative effect on growth rate – but…. • Some populations show the Allee effect – when a population falls too low, some aspect of survival or reproduction is harmed • Cross pollination in plants • Finding a mate • Protection from the wind from a stand of trees
Density dependent limiting factors: • Density independent limiting factors:
K-selected life history strategy (energy and..) – • Have adaptations that maximize success at high population density • Maximize efficient use of resources • Typically fewer, larger offspring with parental care • Larger body • Longer life span • R-selected life history strategy- • Have adaptations that maximize success at low population density • Rapid reproduction- numerous small offspring • Little to no parental care • Best in opportunistic species that live in fluctuating environments • Small body • Mature quickly, short life span • Many species fall somewhere in between! But, natural selection cannot maximize for both • energy trade off • Reproduction vs. survival • Large, cared for babies vs. many babies
Chapter 53 Community Ecology • Niche: • The role a species plays in the community
Competition (-/-) • Gauss’ law
Resource Partitioning can lead to Character Displacement • Individuals in both populations that can avoid competition are at an advantage • can lead to physical changes in the population due to microevolution (character displacement) • Example: Hawks and Owls have similar prey (rodents), but avoid competition by hawks feeding on diurnal species, and owls feeding on nocturnal species
Species Richness vs. species diversity • Consider a cornfield and a woodsy area of the same size. • Describe the differences in species richness • Describe the differences in species diversity • How do you think the same area of rainforest would compare?
Species Richness Describe possible reasoning for the phenomenon seen here.
Reducing energy input reduces trophic levels and species richness. Researchers manipulated the amount of leaf litter provided to a tree hole community. High = natural (control), medium = 1/10 rate, low = 1/100 rate of input.
Starfish as keystone species When starfish were removed from the community, mussels eventually took over. They eliminated most other invertebrates and algae.
Ecosystem Ecology Chapter 54