Download
1 / 16
160 likes | 281 Views
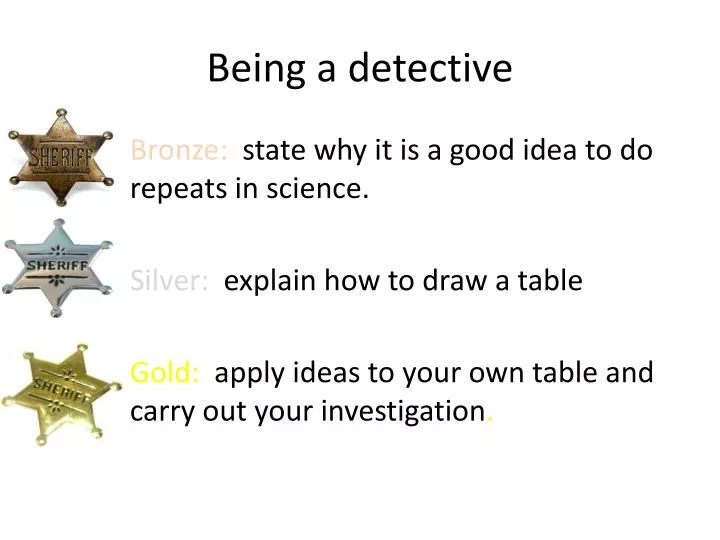
Being a detective. Bronze : state why it is a good idea to do repeats in science. Silver: explain how to draw a table Gold: apply ideas to your own table and carry out your investigation . Crime Scene Challenge.

E N D
Being a detective • Bronze: state why it is a good idea to do repeats in science. • Silver: explain how to draw a table • Gold: apply ideas to your own table and carry out your investigation.
Crime Scene Challenge • Now that your eyes and brain are warmed up, let’s test your observation skills a bit more. • You will have 2 minutes to study the photograph of a crime scene on the next slide. • Try to pay attention to details as you will be asked 10 questions about the crime scene! • You are not allowed to write anything down until after the time is up. • Ready?
Add all the numbers together Divide by the number of values
What is wrong with recording your observations and results In this manner?
A table is a diagram that you draw to collect observations and results systematically Order the steps to drawing a table
Draw the outline of The table and put your two columns in. Draw the outline with a pencil and ruler. Drawing a table
Write in the titles to your columns. You always put in the thing that you are going to change in the first column and things that you are going to measure in the second column. 1st column Thing that changes(title) 2nd column Thing that you (observe/ record title)
Draw in the rows depending on how many different things that you are testing. 1st column Thing that changes( title) 2nd column Thing that you (observe/ record title) Object A Object B Object C Object D Object E Object F
Draw in the columns. You should have a column for everything that you are observing. 1st column Thing that changes( title) 2nd column Thing that you (observe/ record title)
Put in titles above each of the columns 1st column Thing that changes( title) 2nd column Thing that you (observe/ record title) Adding water Object A Object B Object C Object D Object E Object F
Give your table a name A table to show how each of the objects reacted...... 1st column Thing that changes( title) 2nd column Thing that you (observe/ record title) Adding water Object A Object B Object C Object D Object E Object F
Thing that you (observe/ record title) Thing that changes(title) Drawing a table
Can you draw your own table for Your investigation? Draw it in rough first.
Great now it’s your turn to do your investigation. Work your way through your plan and write your results in your method.