Download
1 / 37
380 likes | 564 Views
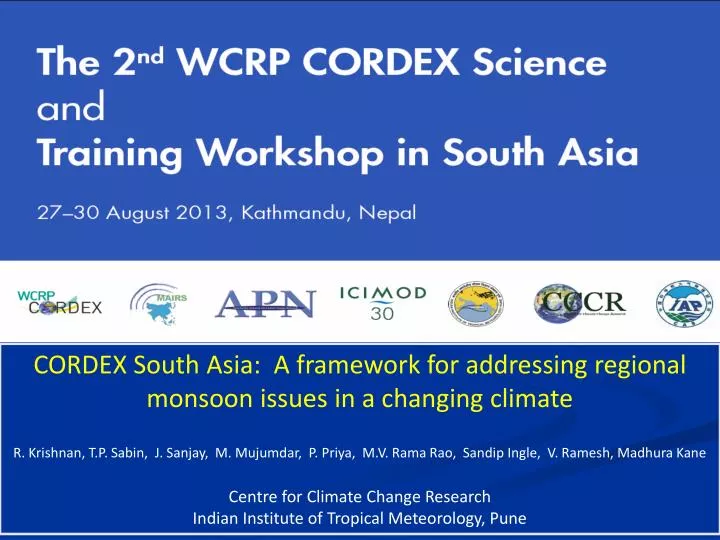
CORDEX South Asia: A framework for addressing regional monsoon issues in a changing climate R. Krishnan, T.P. Sabin, J. Sanjay, M. Mujumdar, P. Priya, M.V. Rama Rao, Sandip Ingle, V. Ramesh, Madhura Kane Centre for Climate Change Research Indian Institute of Tropical Meteorology, Pune.

E N D
CORDEX South Asia: A framework for addressing regional monsoon issues in a changing climate R. Krishnan, T.P. Sabin, J. Sanjay, M. Mujumdar, P. Priya, M.V. Rama Rao, Sandip Ingle, V. Ramesh, Madhura Kane Centre for Climate Change Research Indian Institute of Tropical Meteorology, Pune
Regional climate change projections over South Asia Reliable assessment of regional climate change • High resolution is essential to represent processes properly on all ranges of possible statistical outcomes, especially climate extremes and their impacts • Multi-model ensemble simulations necessary for reliable regional climate projections, and to Quantify and reduce uncertainties in regional climate projections Scientific challenges in modeling extreme climate events • Most occur relatively infrequently and are inherently unpredictable • Require large ensembles to simulate the statistics • Assess the impact of external drivers on their statistics • Depend on dynamical processes that require relatively high resolution to represent them
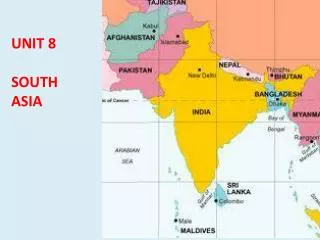
WCRP CORDEX South Asia – led by CCCR, IITM Co-ordinated Regional Downscaling Experiment – CORDEX South Asia South Asia
Evaulation / Baseline run with ERA – Interim boundary conditions (1989 – 2008) Historical run (1950 – 2005) Future projection : 2005 - 2100 (eg., RCP 4.5, 6.0, 8.5 Scenario) CORDEX: Model Experiments Participating Modeling Groups • LMDZ model (~ 35 km ) CCCR (IITM), IPSL • RegCM model (~ 50 km) CCCR (IITM) • HadRM3P model (~ 50 km) CCCR (IITM), Hadley Centre • WRF model (~ 50 km) - CCCR (IITM), BCCR and TERI • MRI model (~ 20 km) global model (MRI, Japan) • RCA model (~ 50 km) Rossby Centre, Sweden • COSMO-CLM (~ 50 km) University of Frankfurt, Germany • CCAM model ( ~ 50 km) CSIRO, Australia
CORDEX-South Asia Multi-Model Output Evaluation Run (1989 – 2008); Historical (1950 – 2005); RCP4.5 scenario (2006- 2100) (To be available by end of September 2013)
LMDZ grid setup for CORDEX South Asia (shaded region has grid-size < 35 km) Source: Sabin, CCCR, IITM
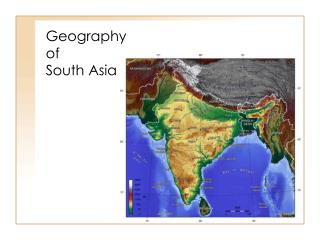
Topography (m) and model grids over the Asian region Hindu Kush Western Ghats Himalayas
PRITHVI (High Performance Computing System) , IITM, Pune Configuration of PRITHVI, HPC at IITM: • IBM P6 575 nodes totaling 117 numbers including the 2 nodes for GPFS quorum and one Login node. Each node is populated with 32 cores of IBM P 6 CPU running at 4.7 G Hz. Total of 3744 cores with Peak Performance of 70 Tflops. • High end Servers P570’s, P550’s, 20 Visual Workstations. • Interconnectivity using Infiniband Switches and Ethernet switches for Management purposes • Total of 3 Peta Bytes of Storage including Online, Near-line and Archival Storage • GPFS, Tivoli and other Management Softwares
Monsoon rainfall (JJAS) Zoom Zoom Zoom No Zoom Mean annual cycles of rainfall (mm day -1) and surface temperature (oC) over the Indian landmass from the zoom and no-zoom runs No Zoom No Zoom
Understanding regional climate change over South Asia High resolution (~ 35 km) dynamical downscaling at CCCR, IITM Historical (1886-2005): Includes natural and anthropogenic (GHG, aerosols, land cover etc) climate forcing during the historical period (1886 – 2005) ~ 120 years Historical Natural (1886 – 2005): Includes only natural climate forcing during the historical period (1886– 2005) ~ 120 years RCP 4.5 scenario (2006-2100) ~ 95 years: Future projection run which includes both natural and anthropogenic forcing based on the IPCC AR5 RCP4.5 climate scenario. The evolution of GHG and anthropogenic aerosols in RCP 4.5 scenario produces a global radiative forcing of + 4.5 W m-2 by 2100
Surface Air Temperature RCP4.5 Global Mean RCP4.5 RCP4.5 Global Tropics (30oS – 30oN) RCP4.5 RCP4.5 Source: Sabin, CCCR, IITM South Asian Monsoon (70oE– 90oE; 10oN– 25oN)
RCP4.5 Global Tropics (30oS – 30oN) Annual mean precipitation JJAS precipitation South Asian Monsoon Region (70oE– 90oE; 10oN– 25oN) RCP4.5 Source: Sabin, CCCR, IITM
High resolution climate data for regional applications • Regional data products, indices, extreme events • Understanding regional climate processes: Links between regional and large-scale variability - (eg., Heavy precipitation events and floods, heat waves, etc). • Applications: Climate, Hydrological, Agriculture, Health, Economy • Evaluation using CORDEX multiple models: eg., Patterns of regional rainfall variability • Impact assessment: eg., River runoff and discharge using macroscale hydrological models • Training workshops: Develop synergistic linkage between climate downscaling and VIA user communities in Asia through direct user engagement
Regional Climate Products: Examples of Applications Heat wave days Mar-Apr-May (MAM) season w.r.t 90th percentile 2010-2020 2050-2060 2080-2090 Source: Sabin, CCCR, IITM
Number of days with temperatures exceeding 45°C in MAM season 2050-2060 2010-2020 2080-2090 Source: Sabin, CCCR, IITM
Monitoring Meteorological Drought using Standardized Precipitation Index (SPI) 2002 2005 2026 2.00 or More : Extremely Wet 1.50 to 1.99 : Severely Wet 1.00 to 1.49 : Moderate Wet 0.00 to 0.99 : Mildly Wet 0.00 to -0.99 : Mildly Dry -1.00 to -1.49 : Moderate Dry -1.50 to -1.99 : Severely Dry -2.00 or Less : Extremely Dry Source: Sabin, CCCR, IITM
Trend in consecutive dry day index (JJAS) 2010-2020 2040-2050 2070-2080 Source: Sabin, CCCR, IITM
Trend in number of extreme rainfall (> 100mm/day) events 2050-2060 2010-2020 2080-2090 Source: Sabin, CCCR, IITM
Regional climate processes: Links between regional and large-scale variability Pakistan Floods 2010: Extent of Pakistan floods detected by AIRS satellite. The Atmospheric Infrared Sounder, AIRS, in conjunction with the Advanced Microwave Sounding Unit, AMSU, senses emitted infrared and microwave radiation from Earth to provide a three-dimensional look at Earth's weather and climate Source: Milind Mujumdar • Westward shift of sub-tropical • High (Mujumdar et al. 2012) • Westward displacement of storms • and departure of synoptic scale • circulation (Houze et al. 2011) • Influence of midlatitude circulation, • European blocking and interaction • with tropical storms (Hong et al. 2011, Saeed et al.2011) • Extended range prediction (~ 15 days lead) (Webster et al. 2011) Climatology 2010 http: airs.jpl.nasa.gov
Uttarakhand (India) floods 2013 200 hPa winds 14-18 June 2013 Courtesy: Sir Prof. Brian Hoskins
Evolution of Uttarakhand heavy rainfall event (June 2013) Interactions between southward intruding mid-latitude troughs and monsoon lows L L 15 June 2013 14 June 2013 16 June 2013 17 June 2013 Courtesy: Ramesh Vellore
Flood Inundated Areas in part of Assam State: 8 June 2012 - Analysis of Radarsat SAR data Flood Hazard Zonation Map of Brahmaputra and Barak Rivers in Assam State – Based on analysis of satellite data during 1998 – 2005 floods Courtesy: National Remote Sensing Centre, India
Rainfall over the southern slopes of the Himalayas & adjoining plains during monsoon breaks (Dhar, Soman and Mulye, 1984) Composite during breaks (Ramesh et al. 2013 Under review) Rainfall Rainfall anomaly Anomalous northward shift of monsoon trough Ramesh et al. 2013
Monsoon break simulation by WRF high-resolution (10 km) model - Courtesy: Ramesh Vellore SLP and 850 hPa winds Day 1 Precipitable water Day 0 500 hPa Geopotential height and winds Day 0 Day 1 Rainfall
High resolution improves rainfall simulation over central-eastern Hiimalayan foothills during monsoon breaks – Ramesh et al. 2013
Simulated annual mean precipitation climatology (1990-2004) bias (mm/d) against the CRU data for 10 CMIP5 AOGCMs and their ensemble mean. Table 2: Subset of CMIP5 AOGCMs. Courtesy: J. Sanjay
Simulated surface air temperature (oC) annual cycle for the 10 selected sub-regions (a-j) over South Asia. The ensemble mean (thick lines) and range (shading) are shown for CMIP5 (green), RCMs driven with ERAI (blue) and RCMs driven with CMIP5 (red) Courtesy: J. Sanjay
The simulated precipitation (mm/day) annual cycle in the 10 selected sub-regions (a-j) over South Asia. The ensemble mean (thick lines) and range (shading) are shown for CMIP5 (green), RCMs driven with ERAI (blue) and RCMs driven with CMIP5 (red) Courtesy: J. Sanjay
Patterns of rainfall variability over Himalayas from multiple models APHRODITE LMDZ SMHI COSMO-CLM Source: Priya, CCCR
Variable Infiltration Capacity (VIC) at 0.125 x 0.125 degree resolution • The key characterestics of VIC are • Subgrid variablity in land- vegetation classes. • Subgrid variability in soil moisture storage capacity • Subgrid variability in topography with use of elevation bands. • Meteorological inputs (precipitation, temperature and windspeed) are given to VIC model as daily time-series. • Land-atmosphere fluxes and water and energy balances are simulated at daily time steps. • Daily runoff and baseflow from VIC model is routed using separate routing model (Lohman.et al.1996) VIC network Routing Model Macroscale Hydrological Modeling • Macro-scale hydrological models(Liang et al. 1994, 1996) are powerful tool to • Understand and assess hydro-climatic variability and flood processes on a river basin scale (Arnell 1999b, Nohara et al. 2006). • Predict the river discharge at un-gauged stations 30 Source: Deepashree Raje and Priya, CCCR
2010 Pakistan floods Analysis of extreme precipitationeg., Gumbell Distribution The distribution toward which the sampling distribution of largest values converge is called Generalized Extreme Value (GEV) Distribution. Gumbell distribution is a special type of GEV Distribution, generally known as EV Type I distribution and it has two parameters. location Parameter scale parameter Source: Priya, CCCR, IITM
Macroscale Hydrological Modeling: Indus Basin Attock Source: Priya, CCCR, IITM 03/15/12
Nash-Sutcliffe Efficiency 0.64 0.7 (Nash and Sutcliffe(1970) Without 1974, NSE = 0.723 Full Period , NSE = 0.709 Global River Discharge (GRD) database Source: Priya, CCCR, IITM
WCRP CORDEX South Asia Training Workshop In partnership with CCCR-IITM, START, ICTP, CSAG, SMHI and ICSU-ROAP 17 – 20 October 2012, Pune, India http://cccr.tropmet.res.in/cccr/home/CORDEX/oct2012/index.html
Summary • Generation of CORDEX South Asia multi-model simulations at IITM and Partner Institutions - Evaluation run, Historical runs and future scenarios eg. RCP4.5. • Multi-model approach to quantify uncertainties in regional climate projections • Development of regional capacity - CORDEX training workshops proposed to be held in South Asia, East Asia and South East Asia in 2013, 2014 and 2015 • Standardize the format of CORDEX South Asia model outputs from multi-model ensemble simulations • Archival, management and sharing of CORDEX South Asia model outputs - Mechanism to consolidate model outputs from all partner institutions • Framework for developing an ESG node at CCCR, IITM for CORDEX South Asia • Framework for Evaluation of CORDEX South Asia model simulations • Develop synergistic linkage between climate downscaling and VIA user communities in Asia through direct user engagement