Download
1 / 10
100 likes | 103 Views
This report highlights the growth in charitable giving in America and provides insights on fundraising trends and strategies. It covers topics such as corporate giving, online channels, donor ethnicity, and future funding projections.

E N D
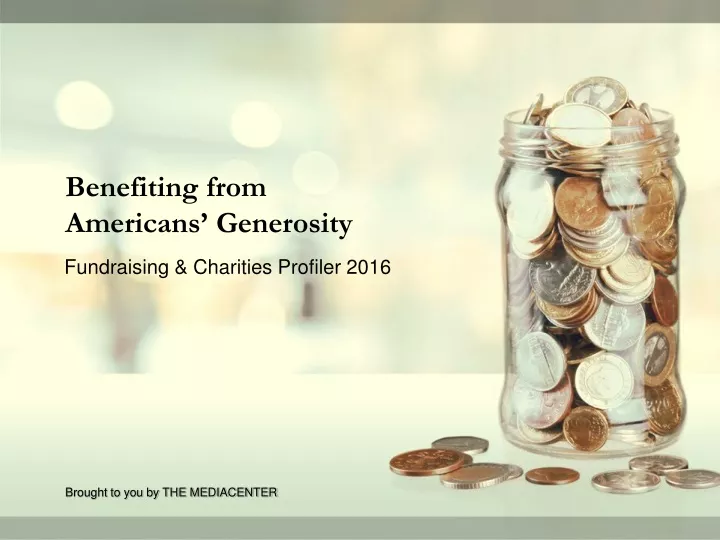
Benefiting from Americans’ Generosity Fundraising & Charities Profiler 2016 Brought to you by THE MEDIACENTER
Blue Chip Growth • According to the latest data available, total giving to charitable organizations was $358.38 billion during 2014, exceeding 2007’s $355.17 billion, the previous largest year ever, and was a 6.9% increase over 2013’s $335.17 billion. • For 2015, total giving increased 4.6% to $477.6 billion, which exceeded the forecast of late 2014 because of the excellent performance of the S&P 500 during early 2015 and job growth throughout the year. • Blackbaud’s 2015 Charitable Giving Report stated that overall giving increased 1.6% and online giving 9.2%, but these numbers are based on a sample of 5,379 nonprofit organizations that raised $18.2 billion, a small percentage of the 2015 total.
Active and Aggressive Campaigning • Of the charities that participated in the Nonprofit Research Collaborative’s July/August 2015 survey, 59% said their receipts increased during the first half of 2015, compared to 52% for the same 2014 period. • Almost three-quarters (74%) of the reporting charities indicated that, as of the end of June 2015, they expected to reach their fundraising goals for fiscal year 2015. This is 4 percentage points greater than 2014’s 70%. • The survey also found that the average period for a capital, endowment or comprehensive campaign was 4.72 years compared to 2.23 years for special campaigns. These campaigns’ average goals were $45.5 million and $3.06 million, respectively.
The Fundraising Flow from Corporate Coffers • In their report, Giving in Numbers: 2015 Edition, the CECP, in association with The Conference Board, found that 56% of companies participating in the survey said their total giving increased during 2014, with 36% said their giving decreased. • For 2015, 41% of the companies said their total giving would remain the same; 38% said giving would increase, with 27% in the 2–10% range; and 21% said their giving would decrease, with the 2–10% range the largest at 10%. • During 2014, health & human services programs received the largest median amount of cash giving, at $2.89 million; followed by community & economic development, $2.10 million; K–12 education, $2.09 million; and higher education, $1.56 million.
European Americans 51% 48% 37% 36% 27% 23% 25% African Americans 50% 40% 37% 37% 12% 19% 23% Latino Americans 45% 30% 40% 31% 21% 17% 20% Asian Americans 34% 35% 35% 36% 16% 29% 16% Nonprofit/Charity Type All Donors 50% 45% 37% 35% 25% 23% 23% Place of worship Local social service organizations Children’s charities Health charities Animal rescue, shelters, etc. Emergency relief efforts Military troops and/or veterans support Blackbaud, Diversity in Giving, 2015 Top 5 Nonprofit/Charity Types Receiving Donations, by Donor Ethnicity, 2014
The Online Channel • According to the M+R Benchmarks Study of 84 nonprofits of various sizes and sectors, revenues generated online and the number of online gifts both increased 13% for 2014; however, the average size of a gift declined 2%. • Although the number of monthly visitors to nonprofits and charities’ Websites increased 11% for 2014, the donation conversion rate declined 0.05% to 0.76%; and $0.61 was raised per each Website visitor, also declining at almost 12%. • Social media was where nonprofits and charities experienced the most growth during 2014, with Facebook and Twitter audiences increasing 42% and 37%, respectively.
Funding Future Needs • In their The Philanthropy Outlook 2016 & 2017 report, the Lily Family School of Philanthropy and Marts & Lundy, fundraising consultants, forecast a 4.1% increase in giving for 2016 and a 4.3% increase for 2017. • These projections, however, were based on an expected above-average growth in the S&P 500, which performed poorly during Q4 2015 and into Q1 2016. Atlas of Giving has published a more conservative increase of 2.6%, to $489.8 billion. • The Lily/Marts & Lundy report forecasts a 6.3% increase in giving to educational institutions for 2016 and 6.1% during 2017, which are both greater than the historical 10-year and 40-year average rates.
Advertising Strategies • Encourage local advertisers to become a sponsor of nonprofit and/or charitable groups and/or events your station is promoting and to generate interest and participation among their customers. • Suggest to your largest advertisers that they allocate a portion of the spots they air throughout the year to promote the charities they support, with video footage of the owner, employees and their families participating in the charity’s programs and fundraising efforts. • Generate goodwill for you and your station by helping to connect local nonprofits and charities with advertisers that match their needs: a clothing retailers collecting old clothes from their customers to donate to a homeless shelter or a car dealer providing a van.
Social Media Strategies • Use social media to encourage the online audience to volunteer time in support of local nonprofits and charities. Invite volunteers to submit photos and videos of their experience and provide a “reward” from a local business for all those uploading visuals. • Large advertisers and/or local corporations and businesses can provide support in the form of professional assistance from their social media marketing department to nonprofits and charities to improve their social media presence and to maximize online giving. • Stories are a very popular on social media sites. Nonprofits and charities should upload photos and videos that tell stories about individuals receiving help from them as well the stories of volunteers and owners of local businesses who are supporters.
Title • Body copy • Body copy • Body copy