Download
1 / 12
120 likes | 219 Views
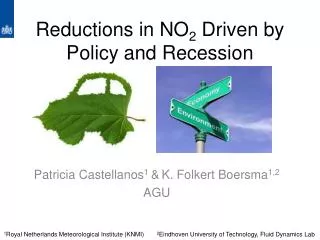
Reductions in NO 2 Driven by Policy and Recession. Patricia Castellanos 1 & K. Folkert Boersma 1,2 AGU . 2 Eindhoven University of Technology, Fluid Dynamics Lab. 1 Royal Netherlands Meteorological Institute (KNMI). Why do we care about NO 2 o ver Europe?.

E N D
Reductions in NO2 Driven by Policy and Recession Patricia Castellanos1 &K. Folkert Boersma1,2 AGU 2Eindhoven University of Technology, Fluid Dynamics Lab 1Royal Netherlands Meteorological Institute (KNMI)
Why do we care about NO2over Europe? 2008 NO2 Annual Mean [μg/m3] • Ozone precursor • Aerosol formation • Eutrophication of soil and water • Acid deposition • Toxic at high concentrations • Limits were supposed to be reached by 2010 • Timeline will be extended by 5 years without penalty Bad air quality costs the UK 8.5-20 billion pounds per year, and can cut life expectancy by years – UK Environmental Audit Committee • Poorly quantified high biases • Lack spatial representativity • Reporting issues • Need an independent assessment of changing NO2 concentrations Satellite Observations
NO2 Trends From Space • Satellites provide • Global coverage • Independent & self-consistent time series • Monitor effectiveness of pollution abatement strategies Space-based European NO2 column trends in the literature A Few % Per Year
NO2 Column Trends • Different summer and winter NO2 lifetimes • Large seasonal fluctuations • Normally only look at one season • Transport effects in winter but not in summer • Cannot always assume some regular seasonal variability Separate the slow-moving trend from other variability Amsterdam
Frequency Separation – KZ Filter K-iterations of a moving average Trends based on low-pass filtered data Transfer Function # of Iterations
NO2 Column Trends: August 2006/2005 2007/2005 2005 2009/2005 2010/2005 2008/2005
Fitting the NO2 Trend • Differentiate between policy (pre-recession) and recession related NO2 changes European Average continuous continuous + recession
2004-2010 Continuous Change Recession Change [Ccontinuousx 6 years] [Crecession] European Average
Recession period reductions were the same or greater thanpre-recession reductions One year of economic recession outweighed ~4-years of policy improvements
Uncontrolled shipping emissions may be reducing air quality in the countries bordering the English channel 2004-2007 Reported NOxEmissions trend ÷ Ccontinuous trend Report increased emissions but NO2 has decreased UK reports reduced emissions but NO2 has increased
Final Remarks • High resolution daily OMI observations allow us to analyze spatially AND temporally heterogeneous trends • NO2 concentrations over Europe are 10-50% lower than in 2004 • Fast declines in NOx emissions during the economic recession led to 15-30% NO2 reductions in 2008-09 European NO2 column trends in the literature