Download
1 / 20
200 likes | 344 Views
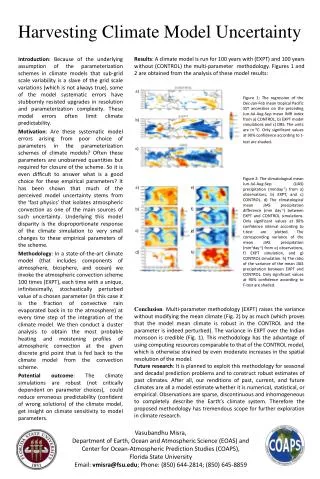
RCM Climate Change Projection Uncertainty. Xin-Zhong Liang Department of Atmosphere & Ocean Science Earth System Science Interdisciplinary Center University of Maryland, College Park. 2013 August 13 NCPP Quantitative Evaluation of Downscaling Workshop.

E N D
RCM Climate Change Projection Uncertainty Xin-Zhong Liang Department of Atmosphere & Ocean Science Earth System Science Interdisciplinary Center University of Maryland, College Park 2013 August 13 NCPP Quantitative Evaluation of Downscaling Workshop
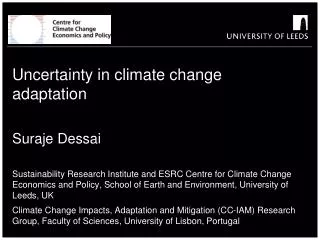
Resolution Increase Does Not Solve All Problems Only MRI with a medium resolution captures the observed NAM rainfall annual cycle. CCSM3 with higher resolution and updated physics reduces PCM amplitude error by half. MIROC3 finer resolution improves the phase but worsens the magnitude . Liang, X.-Z., J. Zhu, K.E. Kunkel, M. Ting, and J.X.L. Wang, 2008: Do CGCMs simulate the North American monsoon precipitation seasonal-interannual variability? J. Climate, 21, 4424-4448 .
CWRF Terrestrial Hydrology Choi 2006; Choi et al. 2007; Choi and Liang 2010; Yuan and Liang 2010; Liang et al. 2010; Choi et al. 2013
D3 D2 D1 Urban and Built-up Dryland Crpland and Pasture Irrigated Cropland and Pasture Cropland/Grassland Mosaic Cropland/Woodland Mosaic Grassland Shrubland Mixed Shrubland/Grassland Savanna Deciduous Broadleaf Forest Evergreen Broadleaf Forest Evergreen Needleleaf Forest Mixed Forest Water Bodies Wooded Wetland Barren or Sparsely Vegetated Wooded Tundra Mixed Tundra CWRF Downscaling Seasonal Climate Prediction over the U.S. NARR LBCs atmosphere Planetary forcing land ICs CAM GFS CWRF SST ICs MLO CFS SST ocean CFS NOAA 2008-2011
RCM Better Resolves Extremes Northeast U.S. Assessment Anderson, B.T., K. Hayhoe, and X.-Z. Liang, 2009: Anthropogenic-induced changes in the 21st Century summertime hydroclimatology of the Northeastern US., Climate Change, doi.10.1007/s10584-009-9673-3.
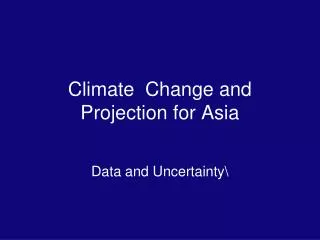
CWRF with ECP/W closure over the U.S. land 1993 JJA Mean Number of Rainy Days Rain Intensity Daily Rainfall 95th Percentile OBS ERI CWRF The reanalysis has already assimilated local observational data, while CWRF is driven by only LBCs. The CWRF skill will be enhanced if assimilating local data.
CWRF Improves Seasonal Climate Prediction a) Spatial frequency distributions of root mean square errors (RMSE, mm/day) predicted by the CFS and downscaled by the CWRF and b) CWRF minus CFS differences in the equitable threat score (ETS) for seasonal mean precipitation interannual variations. The statistics are based on all land grids over the entire inner domain for DJF, JFM, FMA, and DJFMA from the 5 realizations during 1982-2008. From Yuan and Liang 2011 (GRL).
Statistic Metric for RCM Added Value Global model (solid) Consider differences in statistical distribution of skill, not just changes of mean skill. Construct PDFs of skill over a region for both global and regional models. Focus on the part of the distribution above a critical skill level (Sc) representing minimum useful skill. Crossover point Regional model (dashed) Sc Added Value Index (AVI) is the area between the curves beyond the crossover point where regional model skill begins to exceed global model skill (if the crossover point exists). Interpretation: Regional model skill is higher than global model over AVI % of the domain for the corresponding skill range. After Kanamitsu and DeHaan, 2011, J. Geophys. Res., doi:10.1029/2011JD015597 Curtsey of Raymond Arritt
Why Do RCM Results Differ? • Domain:U.S. + Adjacent for CWRF & CMM5, Extended North America for NARCCAP • Resolution: 30 km for CWRF & CMM5, 50 km for all other NARCCAP RCMs • Forcing: linear-exprelaxation in buffer zones of 14 (CWRF, CMM5), 10 (WRFG) grids • linear relaxation in 4 grids (MM5I, HRM3) • domain spectral nudging (ECP2, CRCM) • NARCCAP IA correlations differ largely • due to the strength of forcing integrated • Physics:CWRF is much better than CMM5, being identical in all other settings • Different dynamics may also contribute
Climate Change Uncertainty • Biases from incomplete physics in GCMs & RCMs • Climate sensitivities of GCMs & RCMs • Projecting emissions scenarios • Natural variability
Propagation of GCM Present Climate Biases into Future Change Projections: Temperature Liang, X.-Z., K.E. Kunkel, G.A. Meehl, R.G. Jones, and J.X.L. Wang, 2008: RCM downscaling analysis of GCM present climate biases propagation into future change projections. Geophys. Res. Lett.,35, L08709, doi:10.1029/2007GL032849.
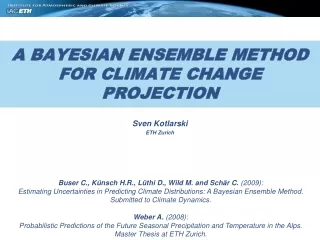
c) Chicago a) Chicago Difference in Annual Number Difference in Annual Number Temperature Increase (°C) Temperature Increase (°C) 1% 1% 1% 1% 1% 10% 10% d) Northeast US b) Northeast US 1% 1% 1% 1% 10% 10% 10% Scenario, Period Scenario, Period Projected U.S. Heat Wave Changes Projections of changes in the average annual 3-day heat wave temperature (°C) for a) Chicago and b) Northeast US and of the annual average number of heat wave days for c) Chicago and d) Northeast US. The two sets of bars on the far left side of a) and b) compare the present-day annual 3-day heat wave temperature spread (from its own summer mean temperature as simulated and observed); and model biases (from observations). The simulations are arranged from left to right in order of increasing greenhouse gas concentrations. The % number at the bar top depicts the corresponding statistical significance level. Kunkel, K.E., X.-Z. Liang, and J. Zhu, 2010: Regional climate model projections and uncertainties of U.S. summer heat waves. J. Climate, 23, 4447-4458.
Optimized Physics-Ensemble Prediction MKF MGR EOP OBS Liang et al. (2007, JCL)
Optimized Physics Ensemble Prediction of Precipitation In summer 1993 The physics ensemble mean substantially increases the skill score over individual configurations, and there exists a large room to further enhance that skill through intelligent optimization. Spatial frequency distributions of correlations (top) and rms errors (bottom) between CWRF and observed daily mean rainfall variations in summer 1993. Each line depicts a specific configuration in group of the five key physical processes (color). The ensemble result (ENS) is the average of all runs with equal (Ave) or optimal (OPT) weights, shown as black solid or dashed line. Liang et al. (2012, BAMS)
What Should We Do? • Structure Uncertainty: • Multiple GCMs with (low, medium, high) climate sensitivities representative of the possible range • Multiple RCMs or physics configurations with notable added values key to the application • Multi-model ensemble with optimal weighting based on present-day climate biases • Emission Scenario: • IPCC Representative Concentration Pathways: RCP 8.5 & 4.5, or also RCP 6.0 & 2.6 if affordable • For projection to 2050, RCP 8.5 & 4.5 is desirable