Download
1 / 32
320 likes | 478 Views
Assessment of a Rapid Approach for Estimating Catchment Areas for Surface Drainage Lines. Lawrence Stanislawski, Science Applications International Corporation (SAIC) Michael Finn, U.S. Geological Survey E. Lynn Usery, U.S. Geological Survey Mark Barnes, U.S. Geological Survey.

E N D
Assessment of a Rapid Approach for Estimating Catchment Areas for Surface Drainage Lines Lawrence Stanislawski, Science Applications International Corporation (SAIC) Michael Finn, U.S. Geological Survey E. Lynn Usery, U.S. Geological Survey Mark Barnes, U.S. Geological Survey ACSM-IPLSA-MSPS 2007, March 9-12, St. Louis, MO
Brief overview of the National Hydrography Dataset (NHD) Generalization Process for NHD Pruning of Drainage Network Preprocessing Requirements Methods Thiessen-polygon-derived (TPD) catchments Elevation-derived (ED) catchments Catchment comparisons Results Between subbasin comparisons Within subbasin comparisons Extended results Summary ACSM-IPLSA-MSPS 2007, March 9-12, St. Louis, MO
Linear Canal/Ditch Areal Lake/Pond Linear Streams Areal Stream/River Linear Connector Areal Lake/Pond NHD Features Artificial Paths ACSM-IPLSA-MSPS 2007, March 9-12, St. Louis, MO
NHD Features ACSM-IPLSA-MSPS 2007, March 9-12, St. Louis, MO
NHD Features Example surface water flow network (NHDFlowline feature class) ACSM-IPLSA-MSPS 2007, March 9-12, St. Louis, MO
Vector data layer of The National Map representing surface waters of the United States. • Includes a set of surface water reaches • Reach: significant segment of surface water having similar hydrologic characteristics, such as a stretch of river between two confluences, a lake, or a pond. • A unique address, called a reach code, is assigned to each reach, which enables linking of ancillary data to specific features and locations on the NHD. Reach code from Lower Mississippi subbasin 08010100000413 region-subregion-accounting unit-subbasin-reach number 08010100000413 National Hydrography Dataset (NHD) 08010100000696 ACSM-IPLSA-MSPS 2007, March 9-12, St. Louis, MO
Divided and distributed at watershed basin and subbasin boundaries. • Stored in an ArcGIS geographic database (geodatabase) model. • Three levels of detail (resolutions) • Medium (1:100,000-scale source) • only complete layer • High (1:24,000-scale source) • 90 percent complete • Local (1:12,000 or larger source) • (expect to include in high resolution layer) National Hydrography Dataset (NHD) Subregions along northern shore of Gulf of Mexico ACSM-IPLSA-MSPS 2007, March 9-12, St. Louis, MO
Develop a generalization strategy that can be implemented on subsets of the NHD. • Strategy should produce a dataset in the NHD model format that maintains: • feature definitions, • reach delineations, • feature relationships, and • flow connections between remaining generalized features. • Extracted dataset should function with NHD applications • less detail • faster processing speed • Extracted level of detail: • user-specified NHD Generalization Development of such a generalization process could eliminate the need to store and maintain all but the highest resolution NHD data layer. ACSM-IPLSA-MSPS 2007, March 9-12, St. Louis, MO
Base data: highest resolution NHD that covers desired area. • Feature pruning – removal of features that are too small for desired output scale. • select a subset of network features • select a subset of area features • remove point features associated with pruned line or area features • Feature simplification • removal of vertices • aggregation, amalgamation, merging, linearization of area features, etc. NHD Generalization Strategy ACSM-IPLSA-MSPS 2007, March 9-12, St. Louis, MO
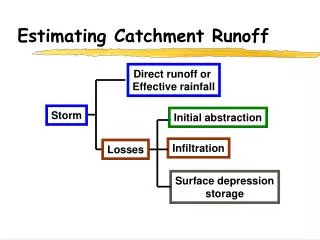
Catchment: The area associated with a segment of a drainage network is referred to as the segment’s catchment area, or just catchment. Surface runoff in the catchment flows into the associated network segment. Catchments (cyan) associated with each network segment (red) of a hydrographic network. The network pruning strategy of our NHD generalization process is based on upstream drainage area, which requires catchment area estimates for each network segment. NHD Generalization ACSM-IPLSA-MSPS 2007, March 9-12, St. Louis, MO
Upstream drainage area (UDA) for any network segment is the sum of all upstream catchment areas, including the segment of interest. For instance, the UDA for the network segment marked with the green square is the yellow shaded area (~ 11.2 sq km). NHD Generalization ACSM-IPLSA-MSPS 2007, March 9-12, St. Louis, MO
Gasconade-Osage subregion (1029) falls in the Interior Plains and Interior Highlands physiographic divisions. Generalization: Network Pruning Example ACSM-IPLSA-MSPS 2007, March 9-12, St. Louis, MO
Feature pruning – removal of feature that are too small for desired output scale. • select a subset of network features Generalization: Network Pruning Example Pruning test on Gasconade-Osage subregion (1029) Green, blue, red: 1:100,000 Blue, red: 1:500,000 Red: 1:2,000,000 ACSM-IPLSA-MSPS 2007, March 9-12, St. Louis, MO
Preprocessing requirements for network pruning: • Catchment area estimates • Upstream drainage area estimates • Values not available for high resolution NHD Layer • Therefore, we developed a rapid approach to estimate catchment areas using Thiessen polygons. NHD Generalization ACSM-IPLSA-MSPS 2007, March 9-12, St. Louis, MO
MethodsThiessen-polygon-derived (TPD) catchments ACSM-IPLSA-MSPS 2007, March 9-12, St. Louis, MO
MethodsComparison to elevation-derived (ED) catchments • Each ED catchment is precisely geospatially associated to one segment of a surface drainage network that is derived from the same elevation model. • Associating ED catchments to each segment of a hydrographic network, such as that in the NHD, is a complex and imprecise process. • Thiessen-polygon derived catchments can be precisely associated with individual segments of any network regardless of how the network is derived. • Generate surface drainage network from an elevation model. • Compute ED catchments for ED network. • Compute TPD catchments for ED network. • 4. Compare ED and TPD catchments through an overlay process. ACSM-IPLSA-MSPS 2007, March 9-12, St. Louis, MO
Study subbasins Methods Six NHD subbasins that fall in one of six regimes based on climate and topography were evaluated. For each subbasin: • A 30-meter resolution DEM was extracted from the National Elevation Dataset. • ED Streams and catchments were derived for several (7) stream formation thresholds. • TPD catchments were generated for all ED network segments • ED catchments and TPD catchments were compared through a spatial union. ACSM-IPLSA-MSPS 2007, March 9-12, St. Louis, MO
Methods • Catchment comparison computations: • For each TPD catchment in all networks: • percent correct, • percent omission, and • percent commission • For all TPD catchments in each stream-formation threshold: • Mean percent correct • Mean percent omission, and • Mean percent commission • Total percent correct • For all stream-formation thresholds in each subbasin: • Average mean percent correct • Average mean percent omission, and • Average mean percent commission • Average total percent correct Thiessen-derived catchment (red outline) overlaying associated elevation-derived catchment (gray outline) with correct area in green, and areas of commission error in purple and omission error in pink . ACSM-IPLSA-MSPS 2007, March 9-12, St. Louis, MO
Methods Computations: Coefficient of areal correspondence (CAC) is computed for any two associated areas as the area of intersection, divided by the area of union. In the figure, CAC is the computed as the green area divided by the sum of all colored (pink, purple, and green) areas. CAC was computed for all catchments of each subbasin and stream-formation threshold, and summarized in the same manner as percent correct values. Thiessen-derived catchment (red outline) overlaying associated elevation-derived catchment (gray outline) with correct area in green, and areas of commission error in purple and omission error in pink . ACSM-IPLSA-MSPS 2007, March 9-12, St. Louis, MO
Results • Number of catchments computed ranged from 957 to 24,603, with catchment density increasing with decreasing stream-formation threshold. • Processing (Pentium 4 CPU, 3.0 GHz, 1 GB RAM) • Speed ED catchments: ~ 10 minutes to 2 hours. • TPD catchments: 2 to 14 minutes (5 to 10 times faster) • Reliability • ED process failed for some of the more dense network computations. • TPD process never failed. • Applicability • ED catchments: requires an integrated DEM and ED network. • TPD catchments: can be applied to any network. ACSM-IPLSA-MSPS 2007, March 9-12, St. Louis, MO
Results • Between subbasin comparisons: • Averages of mean percent correct values range from about 50 to 65, with averages better than 60 on hilly and mountainous subbasins. • Average total percent correct values • range from about 58 to 75. • greater than average mean percent correct for all subbasins. • Average mean omission errors are about 7 percent larger that average mean commission errors. ACSM-IPLSA-MSPS 2007, March 9-12, St. Louis, MO
Results Distribution of percent correct values for all catchments from the 100-cell stream-formation threshold for the mountainous humid subbasin (WV). Mode of distribution is 71. Distribution of percent correct values compared to catchment size for the 100-cell stream-formation threshold in the mountainous humid subbasin (WV). ACSM-IPLSA-MSPS 2007, March 9-12, St. Louis, MO
Results Distribution of percent correct values compared to network segment length for the 100-cell stream-formation threshold in the mountainous humid subbasin (WV). Distribution of percent correct values compared to catchment size for the 100-cell stream-formation threshold in the mountainous humid subbasin (WV). ACSM-IPLSA-MSPS 2007, March 9-12, St. Louis, MO
Results • Between subbasin comparisons: • Average mean coefficient of areal correspondence (CAC) ranges from 0.34 to 0.51, with better correspondence in the hilly and mountainous subbasins. • CAC = Co / (Co+Om+Cm) and Co + Om = 1 • Flat subbasins: ~ 0.5 / (1 + 0.93(0.5)) = 0.34 • Hilly and Mountainous subbasins: ~ 0.67 / (1 + 0.93(0.33)) = 0.51 ACSM-IPLSA-MSPS 2007, March 9-12, St. Louis, MO
ResultsWithin subbasin comparisons Dry: Mountainous (CO) Hilly (TX) Flat (UT) Humid: Mountainous (WV) Hilly (MO) Flat (FL,GA) ACSM-IPLSA-MSPS 2007, March 9-12, St. Louis, MO
Results Within subbasin comparisons: Catchments were separated into headwater (light green) and non-headwater catchments (light blue) based on whether or not they contained a dangling node (cyan) of a stream line. Mean percentages were recomputed for headwater and non-headwater catchments. ACSM-IPLSA-MSPS 2007, March 9-12, St. Louis, MO
Results Headwater average, average, and non-headwater average of the mean coefficient of areal correspondence (CAC) for each formation threshold is shown for each subbasin. ACSM-IPLSA-MSPS 2007, March 9-12, St. Louis, MO
Results: Pruning Tests • 200-cell stream-formation threshold network (green, pink, blue) for hilly dry subbasin (TX). • Pruned networks using UDA values based on ED catchments • Pruned to 1:100,000-scale (pink, blue) • Pruned to 1:500,000-scale (blue) • 200-cell stream-formation threshold network (green, purple, cyan) for hilly dry subbasin (TX). • Pruned networks using UDA values based on TPD catchments • Pruned to 1:100,000-scale (purple, cyan) • Pruned to 1:500,000-scale (cyan) ACSM-IPLSA-MSPS 2007, March 9-12, St. Louis, MO
Results: Pruning Tests ACSM-IPLSA-MSPS 2007, March 9-12, St. Louis, MO
Results: Pruning Tests ACSM-IPLSA-MSPS 2007, March 9-12, St. Louis, MO
Results suggest that the TPD catchment process is: • Less likely to fail because of hardware or software limitations than ED process, • About 5 to 10 times faster than the ED catchment process, • Logistically much simpler to implement than ED process which requires a network integrated to an elevation model. And that the: • Fractional part that TPD catchments overlay ED catchments is about ½ for subbasins in flat terrain and about 2/3 for subbasins in hilly or mountainous terrain. • Headwater TPD catchments exhibit better areal correspondence (up to 17 percent) with ED catchments than do non-headwater catchments. • The lowest areal correspondence of TPD catchments to ED catchments occurs on relatively small catchments or on very short network segments. • Better than 80 percent linear correspondence can be expected between networks pruned to 1:100,000-scale or smaller using UDA based on TPD catchments and UDA based on ED catchments. Summary ACSM-IPLSA-MSPS 2007, March 9-12, St. Louis, MO
Questions?Assessment of a Rapid Approach for Estimating Catchment Areas for Surface Drainage Lines Lawrence Stanislawski, Science Applications International Corporation (SAIC) Michael Finn, U.S. Geological Survey E. Lynn Usery, U.S. Geological Survey Mark Barnes, U.S. Geological Survey ACSM-IPLSA-MSPS 2007, March 9-12, St. Louis, MO