Download
1 / 21
210 likes | 295 Views
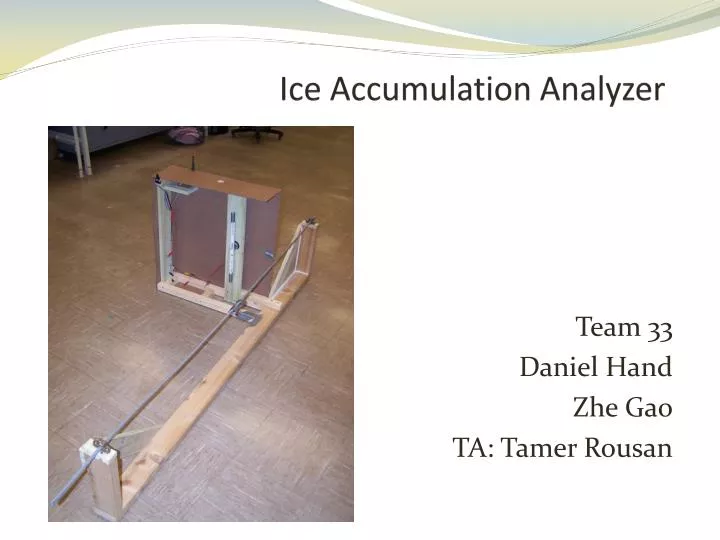
Ice Accumulation Analyzer. Team 33 Daniel Hand Zhe Gao TA: Tamer Rousan. Reasons Prove power lines meet government requirements during severe weather Easily detect the area affected by the ice storm. Benefits Easy analysis of ice thickness on power line Low cost of implementation

E N D
Ice Accumulation Analyzer Team 33 Daniel Hand ZheGao TA: Tamer Rousan
Reasons • Prove power lines meet government requirements during severe weather • Easily detect the area affected by the ice storm • Benefits • Easy analysis of ice thickness on power line • Low cost of implementation • No modifications in infrastructure needed to add capability
Using the frequency of vibration of the power line. The ice thickness can be accurately measured by observing the new frequency of vibration. Dramatic change in frequency as ice accumulates!
System Overview • Hardware • Data Capture: Accelerometer -> Transmitter -> Receiver -> Software • Impact Hammer: 12V battery Supply, Motor, Timing circuit • Software • Perl Program: Record and Analyze Waveforms • Excel Spreadsheet: Calculate Frequency & Determine Ice Thickness
Accelerometer ADXL335 Accelerometer inside case, feeds signal to wireless transmitter TXM-900-HP3-pps Accelerometer on the test line
Receiver RXM-900-HP3-PPS 1/8 “ Audio jack for communication between Receiver and Computer Wireless Receiver
Wireless Signal Strength over Distance Resultant waveforms at increasing distance from 0 ft. to 115 ft (in 11.5 ft increments) Even at a distance of 115 feet, the waveform still retains high signal integrity.
On time (seconds) = .693xR1xC Off time (seconds) = .693xR2xC Duty Cycle=100*R1/(R1+R2) Main concern: output current of LM555 Timer is 200 mA. Schematic of Timing Circuit
Simulated and Actual Waveforms The top waveform is a simulated frequency response of the line tapped with our finger. The bottom waveform shows the response when vibrated by our impact hammer.
End User Software Interface Simple to use. Shows Date and Time of each measurement. Easy to record a new data points.
Application of Low Pass Filter Above is the waveform when the line had 50oz on the line before and after the low pass filter.
Table of Constants Using Excel, we were able to change the values of constants, and these changes in values would propagate throughout all spreadsheets. =
Frequency Testing Tested using play dough to simulate ice The weight of the play dough used to mimic the weight of ice Assume uniform distribution
Actual Thickness vs Calculated Thickness Note that the calculated thickness was half of what was expected
Considerations for future development • Batteries have diminished performances over long lifetimes. • Harness the power line’s voltage through the use of a step down transformerand rectifiers to produce DC power supply. • A more streamlined design that decreased the overall dimensions, while still maintaining accuracy.
Thanks • Professor Reis • Professor Bernhard • Tamer Rousan • Ameren