Download
1 / 1
10 likes | 75 Views
R emote S ensing of the Aerosol I ndirect E ffect on C louds due to B iomass B urning in the A mazon Region

E N D
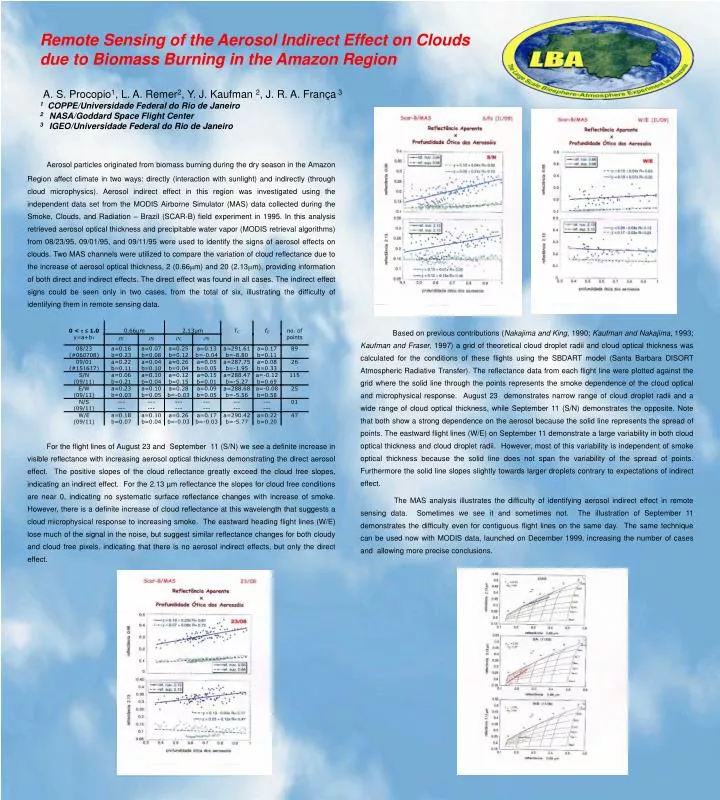
Remote Sensingof the AerosolIndirect Effect on Clouds due to Biomass Burningin the AmazonRegion A.S. Procopio1, L. A. Remer2, Y.J. Kaufman 2, J. R. A. França 31 COPPE/Universidade Federal do Rio de Janeiro2 NASA/Goddard Space Flight Center3 IGEO/Universidade Federal do Rio de Janeiro • Aerosol particles originated from biomass burning during the dry season in the Amazon Region affect climate in two ways: directly (interaction with sunlight) and indirectly (through cloud microphysics). Aerosol indirect effect in this region was investigated using the independent data set from the MODIS Airborne Simulator (MAS) data collected during the Smoke, Clouds, and Radiation – Brazil (SCAR-B) field experiment in 1995. In this analysis retrieved aerosol optical thickness and precipitable water vapor (MODIS retrieval algorithms) from 08/23/95, 09/01/95, and 09/11/95 were used to identify the signs of aerosol effects on clouds. Two MAS channels were utilized to compare the variation of cloud reflectance due to the increase of aerosol optical thickness, 2 (0.66m) and 20 (2.13m), providing information of both direct and indirect effects. The direct effect was found in all cases. The indirect effect signs could be seen only in two cases, from the total of six, illustrating the difficulty of identifying them in remote sensing data. • For the flight lines of August 23 and September 11 (S/N) we see a definite increase in visible reflectance with increasing aerosol optical thickness demonstrating the direct aerosol effect. The positive slopes of the cloud reflectance greatly exceed the cloud free slopes, indicating an indirect effect. For the 2.13 µm reflectance the slopes for cloud free conditions are near 0, indicating no systematic surface reflectance changes with increase of smoke. However, there is a definite increase of cloud reflectance at this wavelength that suggests a cloud microphysical response to increasing smoke. The eastward heading flight lines (W/E) lose much of the signal in the noise, but suggest similar reflectance changes for both cloudy and cloud free pixels, indicating that there is no aerosol indirect effects, but only the direct effect. Based on previous contributions (Nakajima and King, 1990; Kaufman and Nakajima, 1993; Kaufman and Fraser, 1997) a grid of theoretical cloud droplet radii and cloud optical thickness was calculated for the conditions of these flights using the SBDART model (Santa Barbara DISORT Atmospheric Radiative Transfer). The reflectance data from each flight line were plotted against the grid where the solid line through the points represents the smoke dependence of the cloud optical and microphysical response. August 23 demonstrates narrow range of cloud droplet radii and a wide range of cloud optical thickness, while September 11 (S/N) demonstrates the opposite. Note that both show a strong dependence on the aerosol because the solid line represents the spread of points. The eastward flight lines (W/E) on September 11 demonstrate a large variability in both cloud optical thickness and cloud droplet radii. However, most of this variability is independent of smoke optical thickness because the solid line does not span the variability of the spread of points. Furthermore the solid line slopes slightly towards larger droplets contrary to expectations of indirect effect. The MAS analysis illustrates the difficulty of identifying aerosol indirect effect in remote sensing data. Sometimes we see it and sometimes not. The illustration of September 11 demonstrates the difficulty even for contiguous flight lines on the same day. The same technique can be used now with MODIS data, launched on December 1999, increasing the number of cases and allowing more precise conclusions.