Download
1 / 13
130 likes | 242 Views
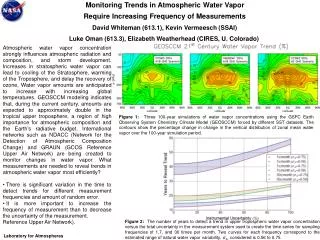
Water Vapor Monitoring using Wireless Communication Networks Measurements. Noam David The Department of Geophysics & Planetary Sciences, TAU. Prof. Pinhas Alpert –meteorology Team members: Dr. Rana Samuels Artem Zinevich Ori Auslender. Prof. Hagit Messer – signal processing Noam David

E N D
Water Vapor Monitoring using Wireless Communication Networks Measurements Noam David The Department of Geophysics & Planetary Sciences, TAU
Prof. Pinhas Alpert –meteorology Team members: Dr. Rana Samuels Artem Zinevich Ori Auslender Prof. Hagit Messer – signal processing Noam David Dani Charkasky Ronen Radian Yoni Ostromtzki TheResearchTeam
User 1 User 2 Base Station 1 Base Station 2 WirelessCommunicationNetworks • These links are built close to the ground, and operate in a frequency range of tens of GHz • In many wireless communication systems the Received Signal Level (RSL) is measured and recorded. • In wireless communication, the RSL depends on atmospheric conditions.
Transmission losses due to atmosphericconditions Absorption and scattering of the radiation, at frequencies of tens of GHz, are directly related to the atmospheric conditions, primarily precipitation, oxygen, water vapor, mist and fog (Ulaby, 1981).
The water vapor density can be measured ! The idea: Water Vapor Monitoring • In typical conditions of: • 1013 hPa pressure • 15ºC temperature • water vapor density of 7.5 gr/m3 • Part of the wireless systems have a magnitude • resolution of 0.1 dB per link.
The model: microwave propagation in moist air - The attenuation due to water vapor and due to dry air [dB/km] f - The link's frequency [GHz]. N” - The imaginary part of the complex refractivity measured in N units, a function of the frequency f [GHz], pressure p[hPa], temperature T [°C] and the water vapor density ρ[gr/m3]. * ITU-R Recommendations P. 676-6: Attenuation by atmospheric gases, September 2005
Ben Gurion Airport Tzrifin 4.53 km Ramla Water Vapor Monitoring Frequency: 22.525 GHz Surface station-link distance: ~6.5 km Length: 4.53 km Receiver and transmitter heights: 95, 63 [m] ASL
Water Vapor Monitoring Number of days: 25 Correlation: 0.89 RMSD: 3.4 [g/m3]
Kiryat Ata Harduf 3.86 km Water Vapor Monitoring Frequency: 22.725 GHz Surface station-link distance: ~7.5 km Length: 3.86 km Receiver and transmitter heights: 265, 233 [m] ASL
Water Vapor Monitoring Correlation: 0.9 RMSD: 1.8 [gr/m3] 2 rainy days were excluded (7 and 22 November)
Summary • Our results show relatively good agreement between the conventional way to measure water vapor and our proposed, novel method • The technique is restricted to weather conditions which exclude rain, fog or clouds along the propagation path • Since measurements from the microwave link are line integrated data, where in-situ measurements are point measurements in a humidity gauge, some disparities are expected • The method only requires standard data (saved by the communication system anyway), therefore the costs are minimal