Download
1 / 64
640 likes | 774 Views
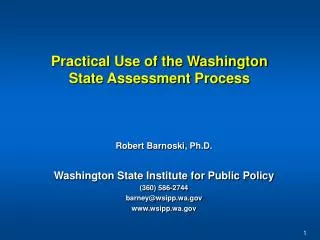
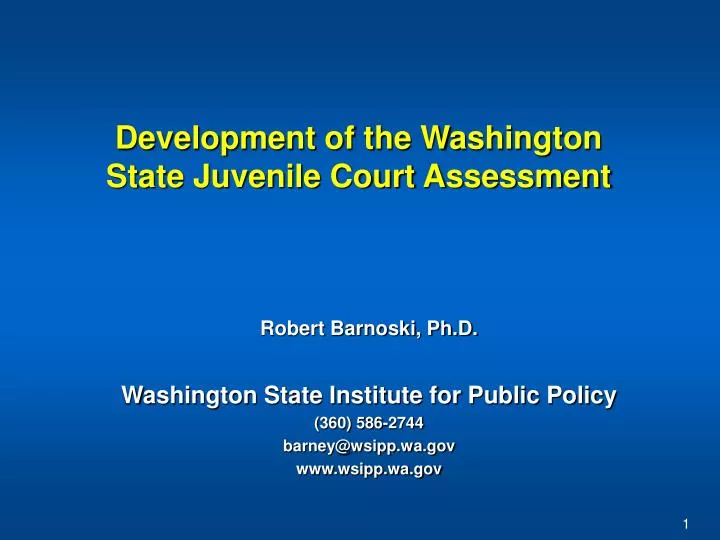
Development of the Washington State Juvenile Court Assessment. Robert Barnoski, Ph.D. Washington State Institute for Public Policy (360) 586-2744 barney@wsipp.wa.gov www.wsipp.wa.gov. Washington State Institute for Public Policy. Created by the Washington State Legislature in 1983.

E N D
Development of the Washington State Juvenile Court Assessment Robert Barnoski, Ph.D. Washington State Institute for Public Policy (360) 586-2744 barney@wsipp.wa.gov www.wsipp.wa.gov
Washington State Institute for Public Policy • Created by the Washington State Legislature in 1983. • A Board of Directors—representing the legislature, the governor, and public universities—governs the Institute. • The Institute’s mission is to carry out practical research, at legislative direction, on issues of importance to Washington State.
1997 Washington State Legislation Community Juvenile Accountability Act “Use a risk assessment to determine which programs are most likely to be effective with particular juvenile offenders” • Youth’s eligibility for program is based on risk assessment: • Level of risk for re-offending. • Profile of risk factors.
Purposes of the Assessment • Estimate level of risk for re-offending. • Target more intensive efforts at higher-risk youth, and little effort at low-risk youth. • Guide the probation effort – case management: To create a common language that increases awareness of factors related to recidivism. Engage and motivate youth through interview Leverage protective factors to reduce risk factors Target intervention by assessment profile Monitor assessment changes. Changing probation practices in 34 juvenile courts • To know what interventions are effective. • Have information to guide court efforts.
Purpose Has Evolved • A way to systematically collect and organize the youth’s social file, supervision progress, and rehabilitative efforts. • As time goes on and needs change, can add domains and items within domains. Gather each piece of information once, but use the information multiple times.
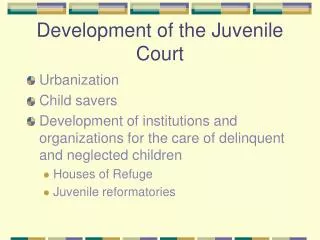
Assessment Development Steps • Literature Review • First Draft Reviewed by Court Staff • First Draft Reviewed by International Experts • Pilot First Draft • Revise First Draft Based on Pilot • Develop and Validate a Subset of Items for Pre-Screening • Implement Assessment • Computer Automation • Validate Full Assessment • Revise Assessment every three years
Literature Reviewed • Wisconsin Model: used for an early intervention program • Juvenile Delinquency Research • Research on Criminal Attitudes • Treatment Literature on Skill Deficits • Resiliency Research • Risk and Protective Factor Research
Reviewed by Experts • Brian Beemus, Oregon Department of Corrections • Bob DeComo, NCCD • David Farrington, University of Cambridge, Institute of Criminology • Jennifer Grotpeter, University of Colorado, Center for the Study & Prevention of Violence • Donna Hamparian, NCCD • Patricia Hardyman, NCCD • Scott Henggeler, Medical University of South Carolina • Robert Hoge, Department of Psychology, Carleton University • Mark Lipsey, Vanderbilt University • Vern Quinsey, Queen’s University • Patrick Tolan, University of Illinois at Chicago • Marilyn VanDeiten, Consultant
Reviewed by Probation Managers and Probation Counselors • Reviewed by court staff for clarity and comprehensiveness • Re-drafted • Piloted Draft • Revised Draft Based on Pilot • Version 2.0 in 1999 • Version 2.1 in 2004 • On-going review
Initial Predictive Validity Assessing Risk for Re-Offending
Recidivism Timing and Measurement Recidivism is a crime resulting in a finding or admission of guilt. Begins on the date the youth is released into the community. Measured on date the offense is committed. An 18 month follow-up to capture 75-80% of re-offending during 5 year period. A 12 month adjudication period to capture 99% of adjudicated offenses. Preliminary recidivism: 12 month follow-up + 6 month adjudication = 18 months Full recidivism: 18 month follow-up + 12 month adjudication = 30 months
WSIPP Recidivism Research Database • No “real” statewide person identifier. • WSIPP spent three years combining various state criminal justice databases. • Still not 100% accurate.
Pre-Screen Criminal History(From Statewide Court Database) 1.Age at first offense 2.Misdemeanor referrals 3. Felony referrals 4.Weapon referrals 5.Against person misdemeanor referrals 6.Against person felony referrals 7.Confinement orders to detention 8.Confinement orders to state institution 9.Escapes 10. Failure to appear warrants
Youth Placed On Probation, Given Diversion, or Released From State Institution During 1995 100% 90% 80% 70% 60% 18-Month Felony and Misdemeanor Recidivism 50% 40% 30% 20% 10% 0% 0 1 2 3 4 5 6 7 8 9 10 11 12 13 14 15 16 17 Criminal History Score State Institution (N=1,367) Probation N=8,827 Diversion N=15,548
Percentage of Youth Grouped by Criminal History Score 100% 90% 76% 80% 68% 70% 60% Percentage Within Disposition Group 49% State Institution 50% 39% Diversion 40% 31% Probation 30% 21% Probation (N=3,483) 20% Diversion (N=4,872) 12% State Institution 10% 3% 2% 0% 0 to 3 4 to 7 Above 7 Criminal History Score Groups
Area Under Receiver Operator Characteristic = 0.647 Correlation Coefficient = .22 48% Felony Recidivism Rate=22.8% 42% 34 % 27% 18 Month Felony Recidivism Rate 23% 18% 16% 13% - 18 9% 7% Zero 1 to 2 3 to 4 5 to 5 6 to 6 7 to 8 9 to 10 11 to 15 16 to 20 Over 20 (0.6%) (4.7%) (15.8%) (12.9%) (12.5%) (19.4%) (11.8%) (15.7%) (5.1%) (1.4%) Criminal History Score (Percent of Sample)
Pre-Screen Social History 1.Male gender 2. School attendance, grades, and misconduct 3.Friends, pro-social, anti-social, and gang 4.Court-ordered/DSHS voluntary out-of-home/shelter care placements 5.Runaways or times kicked out of home 6.Family members have been to jail/prison 7.Current parental rule enforcement and control 8.Alcohol/drugs disrupt functioning 9.Victim of physical/sexual abuse 10.Victim of neglect 11.Mental problems
Area Under Receiver Operator Characteristic = 0.634 Correlation Coefficient = .20 48% 38% 34% 31% 18 Month Felony Recidivism Rate 27% 21% 17% 13% 10% 4% Zero 1 to 2 3 to 3 4 to 5 6 to 7 8 to 9 10 to 11 12 to 12 13 to 15 Over 15 (0.8%) ( 9 .6%) (7.6%) (18.3%) (19.9%) (18.4%) ( 14.1%) (4.4%) (6.1%) (1.0%) Social History Score (Percent of Sample)
14 12 10 8 Average Social History Average Social History Score Score for Each Criminal 6 History Score 4 2 0 0 5 10 15 20 25 30 Criminal History Score
40% 37.9% 35% Moderate Social High Social Risk Score Risk Score (6 to 9) 27.8% (10 to 18) 30% 29.7% 25% 20.0% 20% 18 Month Felony Recidivism Rate 22.4% 21.4% 15% 11.2% 16.2% Low Social Risk Score 13.2% (0 to 5) 10% 10.9% 8.9% 7.8% 5% 0% 0 to 2 3 to 4 5 to 7 8 to 31 Pre - Screen Criminal History Score
Pre-Screen Assessment Validity Summary 18 Month Recidivism Risk Level Low Moderate High Total Number of Assessments 5,880 5,817 8,642 20,339 Percent of Sample 28.9% 28.6% 42.5% 100.0% Total Recidivism 34.0% 47.8% 61.8% 49.7% Felony Recidivism 11.2% 20.6% 32.2% 22.8% Violent Felony Recidivism 2.9% 5.9% 11.0% 7.2%
Area Under Receiver Operator Characteristic = 0.6 4 Correlation Coefficient = .21 High ( N = 20,339) 42.5% 18 - 32.2% Low 28.9% Moderate 28.6% Month Felony Recidivism Rates 20.6% 11.2% Low - Risk Level Moderate - Risk Level High - Risk Level
Percentage of Low Risk Youth Who Re-Offended Within Six Months of Start of Supervision • Allowing Six Months For Adjudication Violent Felony 1% Non-Violent Felony 4% None 84% Misdemeanor 11%
Six-Month Recidivism for Low, Moderate and High Risk Youth 50% 45% Low Risk Recidivism 40% 37.0% 35% Moderate Risk Recidivism 30% 24.7% Six-Month Recidivism Rate 25% High Risk Recidivism 21.4% 20% 15.9% 15.6% 15.0% 15% 11.3% 10.9% 9.7% 10% 6.7% 4.6% 4.7% 5% 3.6% 2.8% 1.1% 0% Violent Felony Non-Violent Felony Felony Misdemeanor Any Recidivism
Risk Prediction of Felony and Violent Felony Recidivism 50% Felony (23%) 42% Violent Felony (7%) 40% 30% 24% 19% 20% 16% 11% 10% 7% 5% 3% 0% Low Risk (28.6%) Moderate Risk High Felony Risk High Violent Risk (27.0%) (24.1%) (20.3%)
Assessment Item Information: 7. Age First Expulsion Correlation With Felony Recidivism: .12 Response 18-Month Recidivism Rates: Total(54.9) Felony (25.9) Violent Felony (8.3) 0 (Never) 45.6(-9.2) 18.2(-7.7) 5.3(-3.0) 1 (15 to 17) 45.9(-9.0) 19.4(-6.6) 5.0(-3.2) 2 (12 to 14) 54.6(-0.3) 25.5(-0.4) 7.7(-0.6) 3 (5 to 11) 63.6(+8.7) 33.1(+7.1) 11.9(+3.7) Percentage Distribution Low Moderate High Total 0 (Never) 29.1 18.9 14.8 18.0 1 (15 to 17) 12.5 11.8 6.4 8.9 2 (12 to 14) 41.9 43.8 43.2 43.2 3 (5 to 11) 16.5 25.5 35.6 29.8
Gender 50% Male Female 36% 40% 30% 23% 18-Month Felony Recidivism Rate 18% 20% 13% 13% 6% 10% 0% Low Risk Moderate Risk High Risk
Adding 10 points to the risk score for being a male shifts the male risk line to the right by 10 units. For example, a male score of 5 with a recidivism rate of 4.3% becomes a score of 15. As a result, risk scores result in similar recidivism rates for females and males. 50% 45% 40% 35% 30% Males Plus 10 points Males 18-Month Felony Recidivism 25% 20% 15% Females 10% 5% 0% 5 10 15 20 25 30 35 40 Risk Score
Age At Adjudication 50% Under14 14 to 16 40% Over 16 38% 33% 26% 30% 28% 18-Month Felony Recidivism Rate 22% 20% 12% 15% 12% 10% 9% 0% Low Risk Moderate Risk High Risk
Sex Offenders 50% No Prior Sex Offense Prior Sex Offense 40% Felony: 32% 30% 18-Month Felony Recidivism Rate 21% 24% 20% 14% Violent Felony: 11% 11% 10% 6% 8% 4% 5% 3% 3% 0% Low Risk Moderate Risk High Risk
Ethnicity 50% African American 43% Asian American 40% 39% Native American 32% European American 31% 26% 30% 30% 18-Month Felony Recidivism Rate 21% 17% 20% 19% 16% 11% 10% 10% 0% Low Risk Moderate Risk High Risk
50% 45% 40% 35% 30% 27.9% Average Predicted Recidivism Probability 23.7% 25% 22.9% 22.4% 20% 15% 10% 5% 0% European(1) Afrcian(2) Native(3) Asian(5)
10.00 European(1) Afrcian(2) 8.88 9.00 8.69 Native(3) Asian(5) 8.10 8.00 7.70 7.65 7.18 7.03 7.00 6.30 6.00 Average Score 5.00 4.00 3.00 2.00 1.00 0.00 Pre-Screen Criminal History Score Pre-Screen Social History Score
Mental Health Afrcian(2) Neglect European(1) Abuse Alcohol/drug Parental Rule Crim Family Runaway Out-Of-Home Peers School Male FTA Escapes JRA Disp Detention Person Felony Person Misdem Weapon Felony Misdem Age First Adj 0.00 0.50 1.00 1.50 2.00 2.50 3.00
What May Be Influencing • Social-economic forces. • Societal discrimination. • Higher Crime Areas – arrests. • Unstructured decision making . • Washington has structured judicial sentencing. • George Bridges Study. • Decline of jurisdiction study.
Keeping the End in Mind • The goal is to institutionalize the assessment and risk reduction process. • The goal can best be achieved when the assessment and risk reduction process help probation staff to do their job.
Assessment StructureA systematic way to collect and record information you need to know about the youth.
Because the Assessment is Comprehensive, a multi-stage process is used: • (Pre-adjudication detention hold) • Pre-Screen. • Full Assessment. • Re-assessment
Assessment Series • Pre-screen for all youth. • Initial assessment at start of supervision only for moderate to high risk youth. • Re-assessments while being supervised, at program completion. • Final assessment at end of supervision. • Assessment series ends by completion of supervision or new adjudication.
Domains History: Any time in the past. Current: Within last six months (initial) or the last four weeks (re-assessment).
Items Risk: Negative factors that increase likelihood of re-offending. Protective: Positive factors targeted for change, absence is not a risk. Static: Historic factors, not targeted for change. Dynamic: Factors targeted for change. Check most appropriate/Check all that apply. Pivot items: indicate need to complete next part of domain. Barriers: Factors making it difficult to work with the youth or family – responsivity.
Rules • Cannot update an item in a history domain, must correct throughout the series. • Cannot open a new series until the current is closed. • Can not complete a current domain if pivot item does not indicate a current problem. • Must complete all items within a domain.
Scoring Level of risk (Low, moderate and high). Program eligibility score and criteria. Domain risk and protective factor scores and percentiles. Risk and protective factors are scored to emphasize change: same item can have one response that is a risk factor, and another response that is a protective factor.
Pre-Screen Domains 1: Record of Referrals 2: Social History 3: Attitude/Violence
Pre-Screen Criminal History(From Statewide Court Database) Maximum 1.Age at first offense 4 points 2.Misdemeanor referrals 3 points 3. Felony referrals 6 points 4.Weapon referrals 1 point 5.Against person misdemeanors 2 points 6.Against person felony referrals 4 points 7.Confinement orders to detention 3 points 8.Confinement to state institution 4 points 9.Escapes 2 points 10. Failure to appear warrants 2 points
Pre-Screen Social History Risk (Wisconsin Model - Washington Data) 1.Male gender 1 point 2. School attendance, grades, and misconduct 2 points 3.Friends, pro-social, anti-social, and gang 3 points 4. Out-of-home/shelter care placements 1 point 5.Runaways or times kicked out of home 1 point 6.Family members have been to jail/prison 1 point 7.Current parental rule enforcement and control 2 points 8.Alcohol/drugs disrupt functioning 2 points 9.Victim of physical/sexual abuse 1 point 10.Victim of neglect 2 points 11.Mental problems 1 point
Full Assessment Domains • Record of Referrals • Demographics • School History & B: Current School Status • A: Historic Use of Free Time & B: Current Use of Free Time • A: Employment History & B: Current Employment • A: History of Relationships & B: Current Relationships • A: Family History & B: Current Living Arrangements • A: Alcohol and Drug History & B: Current Alcohol and Drugs • A: Mental Health History & B: Current Mental Health • Attitudes/Behaviors • Aggression • Skills
Additional Future Domains • Sexual Attitudes/Behaviors • Physical Health/Vulnerabilities • Institutional Performance • Performance on Supervision • Program/Treatment Performance • Community Factors
Additional Future Items Within a Domain • For example, add DSM Axis I Diagnosis to mental health domain • Add whether aggression is instrumental or impulsive to aggression domain.