Download
1 / 24
240 likes | 398 Views
US Population Doubled while the Texas Population Tripled 1950-2010. Population growth of the City and El Paso County- 1950-2010. Texas City Populations- 2010. 20 years ago, El Paso was the 4 th most populous city in Texas- it’s now 6 th. The two cities that surpassed us- Austin- 790,390

E N D
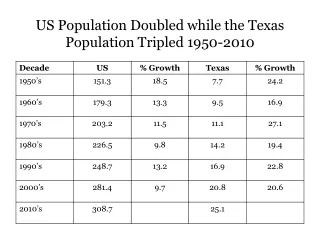
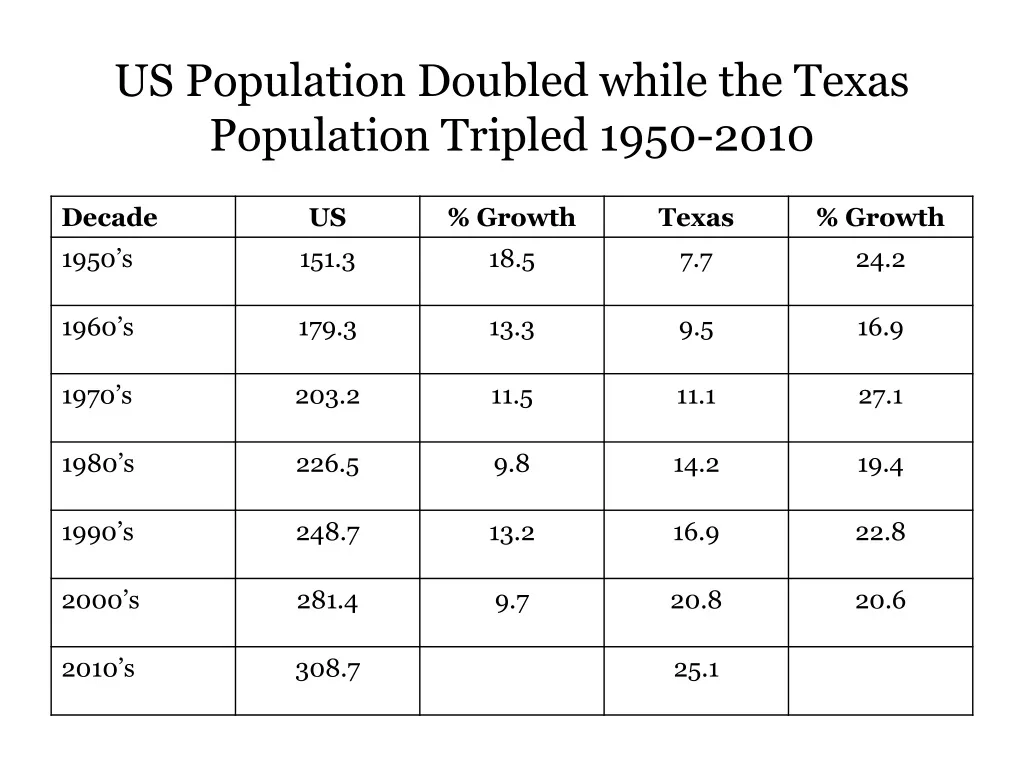
US Population Doubled while the Texas Population Tripled 1950-2010
20 years ago, El Paso was the 4th most populous city in Texas- it’s now 6th • The two cities that surpassed us- • Austin- 790,390 • Fort Worth- 741,206 • We grew quickly, 15% during the 2000 decade, but not nearly at the rate as that part of the State from I-35 eastward.
Texas Population Growth 2000-2010 Source: 2010 U.S. Census
Some politics • From the end of the civil war to the end of the 1970’s Texas was dominated by the Democrats. • From the 1980’s to now- an evolution toward the GOP, primarily by Whites. • The GOP now controls state government and is the jewel in the GOP’s national political crown. • Most African Americans, Asian Americans and Latinos stayed with the Democrats. • This strongly explains the next slide of statewide partisan support.
GOP’s Growth & Opportunity Project’s post-election analysis- ethnicity and race • “…many minorities wrongly think that Republicans do not like them or want them in the country.” • “We have become expert in how to provide ideological reinforcement to like-minded people, but devastatingly we have lost the ability to be persuasive with, or welcoming to, those who do not agree with us on every issue.” • “If we want racial and ethnic minority voters to support Republicans, we have to engage them and show our sincerity.” • “The key problem is that the Republican Party’s message offends too many people unnecessarily. We win the economic message, which is the most important to voters, but we then lose them when we discuss other issues.”
George W. Bush’s 1998 gubernatorial re-election • Bush stated publically that he wanted to win in El Paso County. • His strategy- many visits and campaign ads targeted at the voters, especially Latino voters. • He got 50.01% of the vote. • Student exit poll- 37% of Latinos surveyed voted for Bush. • In 2000- he lost in EP county- 39.7% of all votes cast. • Student exit poll- 25% of Latinos surveyed voted for Bush.
Political Participation Socio demographics Mobilization
The two most powerful socio demographic variables that predict the likelihood of participating • Age- as age increases through the 60’s, the likelihood of participating increases. • Median age in the US- 37 years • Median age in Texas- 33.5 years • Median age in El Paso- 32.5 years
The two most powerful socio demographic variables that predict the likelihood of participating • Level of education- the higher the level of education attainment the greater the likelihood of participating. • For those age 25 and over- the percent with no HS diploma • US- 12.4% • Texas- 19.6% • El Paso- 25.4%