Download
1 / 20
200 likes | 342 Views
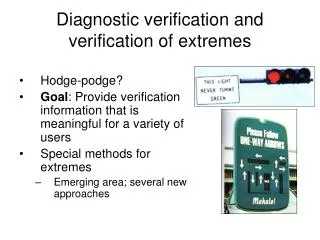
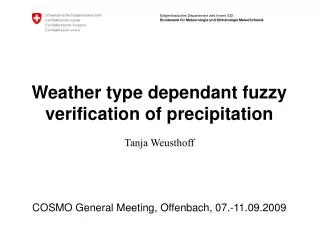
Fuzzy verification of fake cases. Beth Ebert Center for Australian Weather and Climate Research Bureau of Meteorology. observation. forecast. Frequency. Forecast value. t - 1. t. Frequency. t + 1. Forecast value. Fuzzy (neighborhood) verification.

E N D
Fuzzy verification offake cases Beth Ebert Center for Australian Weather and Climate Research Bureau of Meteorology NCAR, 15 April 2008
observation forecast Frequency Forecast value t - 1 t Frequency t + 1 Forecast value Fuzzy (neighborhood) verification • Look in a space / time neighborhood around the point of interest • Evaluate using categorical, continuous, probabilistic scores / methods • Will only consider spatial neighborhood for fake cases NCAR, 15 April 2008
observation forecast observation forecast Fuzzy verification framework Fuzzy methods use one of two approaches to compare forecasts and observations: single observation – neighborhood forecast (user-oriented) neighborhood observation – neighborhood forecast (model-oriented) NCAR, 15 April 2008
good performance poor performance Fuzzy verification framework NCAR, 15 April 2008
UpscalingNeighborhood observation - neighborhood forecast Average the forecast and observations to successively larger grid resolutions, then verify as usual % change in ETS Weygandt et al. (2004) NCAR, 15 April 2008
Fractions skill scoreNeighborhood observation - neighborhood forecast Compare forecast fractions with observed fractions (radar) in a probabilistic way over different sized neighbourhoods observed forecast Roberts and Lean (2008) NCAR, 15 April 2008
single threshold Spatial multi-event contingency tableSingle observation - neighborhood forecast Vary decision thresholds: • magnitude (ex: 1 mm h-1 to 20 mm h-1) • distance from point of interest (ex: within 10 km, .... , within 100 km) • timing (ex: within 1 h, ... , within 12 h) • anything else that may be important in interpreting the forecast Fuzzy methodology – compute Hanssen and Kuipers score HK = POD – POFD Measure how close the forecast is to the place / time / magnitude of interest. ROC Atger (2001) NCAR, 15 April 2008
Practically perfect hindcasts Single observation - neighborhood forecast Q: If the forecaster had all of the observations in advance, what would the "practically perfect" forecast look like? • Apply a smoothing function to the observations to get probability contours, choose yes/no threshold that maximizes CSI when verified against obs • Did the actual forecast look like the practically perfect forecast? • How did the performance of the actual forecast compare to the performance of the practically perfect forecast? Fuzzy methodology – compute forecast PracPerf CSIforecast = 0.34 CSIPracPerf = 0.48 Kay and Brooks (2000) NCAR, 15 April 2008
good bad 12.7 mm 25.4 mm 1st geometric case50 pts to the right NCAR, 15 April 2008
good bad 2nd geometric case200 pts to the right NCAR, 15 April 2008
good bad 5th geometric case125 pts to the right and huge NCAR, 15 April 2008
Case 1 better ~same Case 5 better 1st case vs. 5th case NCAR, 15 April 2008
1000 km Perturbed cases (4) Shift 24 pts right, 40 pts down "Observed" (6) Shift 12 pts right, 20 pts down, intensity*1.5 Which forecast is better? NCAR, 15 April 2008
good bad 4th perturbed case24 pts right, 40 pts down NCAR, 15 April 2008
good bad 6th perturbed case12 pts right, 20 pts down, intensity*1.5 NCAR, 15 April 2008
Case 6 - Shift 12 pts right, 20 pts down, intensity*1.5 Case 6 – Case 4 Difference between cases 6 and 4 Case 4 - Shift 24 pts right, 40 pts down 6 4 NCAR, 15 April 2008
How do fuzzy results for shift + amplification compare to results for the case of shifting only? Case 6 - Shift 12 pts right, 20 pts down, intensity*1.5 Case 3 - Shift 12 pts right, 20 pts down, no intensity change Case 6 – Case 3 6 3 Why does the case with incorrect amplitude sometimes perform better?? Baldwin and Kain (2005): When the forecast is offset from the observations most scores can be improved by overestimating rain area, provided rain is less common than "no rain". NCAR, 15 April 2008
Some observations about methods Traditional • Measures direct correspondence of forecast and observed values at grid scale • Hard to score well unless forecast is ~perfect • Requires overlap of forecasts and obs Entity-based (CRA) • Measures location error and properties of blobs (size, mean/max intensity, etc.) • Scores well if forecast looks similar to observations • Does not require much overlap to score well Fuzzy • Measures scale- and intensity-dependent similarity of forecast to observations • Forecast can score well at some scales and not at others • Does not require overlap to score well NCAR, 15 April 2008
Some final thoughts… Object-based and fuzzy verification seem to have different aims Object-based methods • Focus on describing the error • What is the error in this forecast? • What is the cause of this error (wrong location, wrong size, wrong intensity, etc.)? Fuzzy neighborhood methods • Focus on skill quantification • What is the forecast skill at small scales? Large scales? Low/high intensities? • What scales and intensities have reasonable skill? • Different fuzzy methods emphasize different aspects of skill NCAR, 15 April 2008
Some final thoughts… When can each type of method be used? Object-based methods • When rain blobs are well defined (organized systems, longer rain accumulations) • When it is important to measure how well the forecast predicts the properties of systems • When size of domain >> size of rain systems Fuzzy neighborhood methods • Whenever high density observations are available over a reasonable domain • When knowing scale- and intensity-dependent skill is important • When comparing forecasts at different resolutions NCAR, 15 April 2008