Download
1 / 22
220 likes | 376 Views
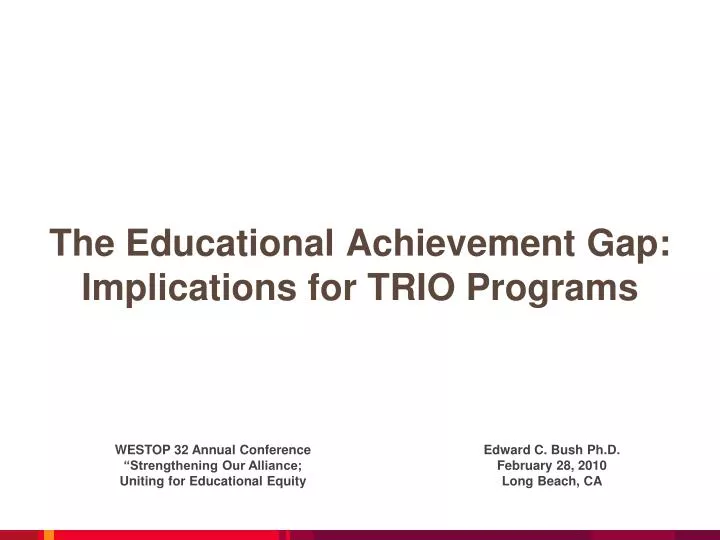
The Educational Achievement Gap: Implications for TRIO Programs. WESTOP 32 Annual Conference “Strengthening Our Alliance; Uniting for Educational Equity. Edward C. Bush Ph.D. February 28, 2010 Long Beach, CA. What is the Achievement Gap?.

E N D
The Educational Achievement Gap:Implications for TRIO Programs WESTOP 32 Annual Conference “Strengthening Our Alliance; Uniting for Educational Equity Edward C. Bush Ph.D. February 28, 2010 Long Beach, CA
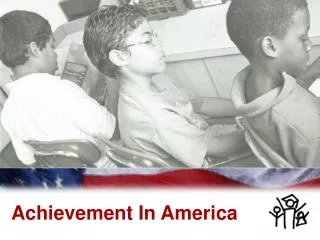
What is the Achievement Gap? An achievement gap refers to the observed disparity on a number of educational measures between the performance of groups of students, especially groups defined by gender, race/ethnicity, ability, and socioeconomic status.
Of Every 100 White Kindergartners: (25-to 29-Year-Olds) Source: US Department of Commerce, Bureau of the Census. March Current Population Surveys, 1971-2001, in The Condition of Education 2002.
Of Every 100 African American Kindergartners: (25-to 29-Year-Olds) Source: US Department of Commerce, Bureau of the Census. March Current Population Survey, 1971-2001, In The Condition of Education 2002.
Of Every 100 Latino Kindergartners: (25-to 29-Year-Olds) Source: US Department of Commerce, Bureau of the Census. March Current Population Surveys, 1971-2001, In The condition of Education 2002.
Students Graduate From High School At Different Rates Source: US Bureau of Census, Current Population Reports, Educational Attainment in the United States: March 1998 (p. 20-513), Detailed Tables No. 2
Minority Students Get More Inexperienced* Teachers *Teachers with 3 or fewer years of experience. “High” and “low” refer to top and bottom quartiles. Source: National Center for Education Statistics, “Monitoring Quality: An Indicators Report,” December 2000.
Highest Achieving Low-Income Students Attend Postsecondary at Same Rate as Bottom Achieving High Income Students Source: NELS: 88, Second (1992) and Third Follow up (1994); in, USDOE, NCES, NCES Condition of Education 1997 p. 64
High School Completers Who Were Enrolled in College the October After Completing High School, By Family Income (2001) Source: USDE, NCES. The Condition of Education 2003, NCES 2003-067.
Bachelor’s or Higher Degree by Age 26 * SES= Socio Economic Status Source: National Center for Education Statistics Statistical Analysis Report, Coming of Age in the 1990s: The Eighth-Grade Class of 1988 12 Years Later, U.S. Department of Education Office of Educational Research and Improvement; June 2002.
High-Poverty Schools Get More Low-Scoring* Teachers *Teachers scoring in the bottom quartile on SAT/ACT. “High-poverty” schools have 2/3 or more students eligible for reduced-price lunch. Source: Education Week, “Quality Counts 2001,” January 2001.
Predictors for Success in School • Highly Qualified Teachers • Involved Parents/Guardians • Stability • Relevant Education • Access to Challenging Curriculum • Highly Funded School • Parents/Guardians Educational Level • White or Asian • Positive Peer Interactions • High Parents/Guardians Income • Low Teacher/Student Ratio • High Teacher Expectations
Predictors of School Failure • Changing Schools • Student of Color • Lack of Access to Challenging Curriculum • Inadequate Instruction • Low Socioeconomic Status • Low Teacher Expectation • Low Parent Educational Level • Disengaged Parents / Guardians • Overcrowded Schools • Under Funded Schools • School Mobility
The Real Gap: • Cultural • Economic • Expectations • Service • Resource • Infrastructure • Communication • Instructional • Curriculum • Generational
Gap Fillers • Return to Your Roots • Abandoned The Missionary Model