Download
1 / 1
30 likes | 159 Views
Characterisation of the Sea Surface Microlayer Using Langmuir Films and Ellipsometry Wendy King a , Robert Greef a , Valborg Byfeild b , Stanislav Ermakov c and Jeremy G. Frey a a Department of Chemistry, University of Southampton, England, b NOC, University of Southampton, England,

E N D
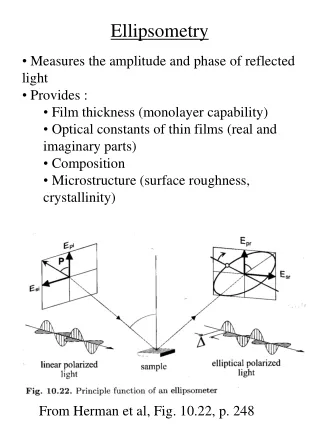
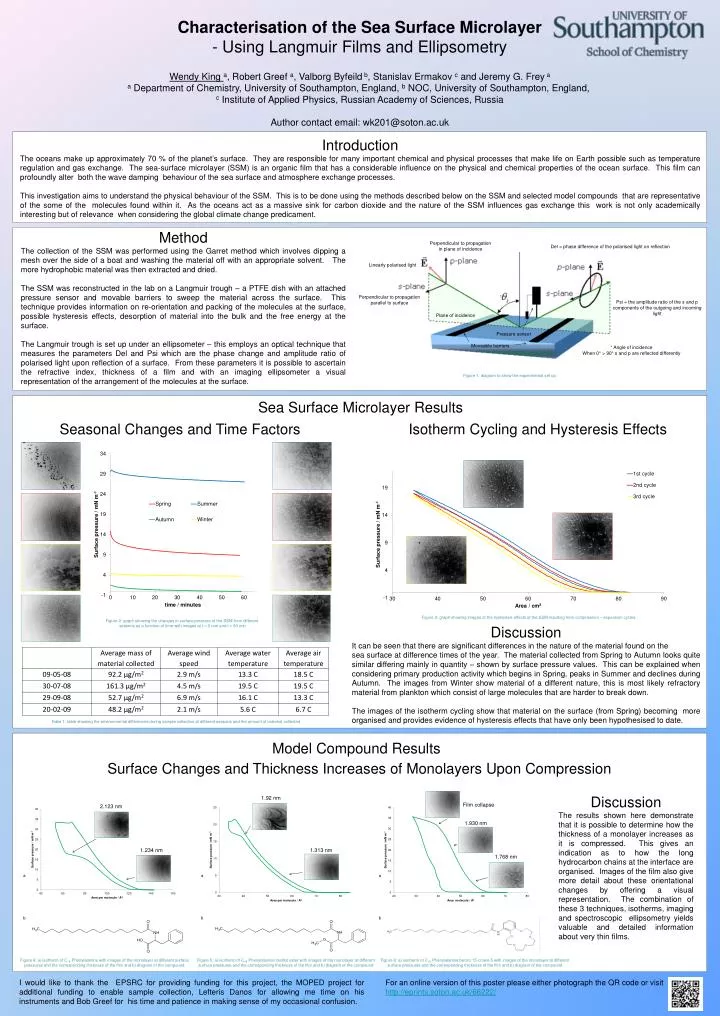
Characterisation of the Sea Surface Microlayer • Using Langmuir Films and Ellipsometry • Wendy King a, Robert Greef a, Valborg Byfeild b, Stanislav Ermakov c and Jeremy G. Frey a • a Department of Chemistry, University of Southampton, England, b NOC, University of Southampton, England, • c Institute of Applied Physics, Russian Academy of Sciences, Russia • Author contact email: wk201@soton.ac.uk Introduction The oceans make up approximately 70 % of the planet’s surface. They are responsible for many important chemical and physical processes that make life on Earth possible such as temperature regulation and gas exchange. The sea-surface microlayer (SSM) is an organic film that has a considerable influence on the physical and chemical properties of the ocean surface. This film can profoundly alter both the wave damping behaviour of the sea surface and atmosphere exchange processes. This investigation aims to understand the physical behaviour of the SSM. This is to be done using the methods described below on the SSM and selected model compounds that are representative of the some of the molecules found within it. As the oceans act as a massive sink for carbon dioxide and the nature of the SSM influences gas exchange this work is not only academically interesting but of relevance when considering the global climate change predicament. Method The collection of the SSM was performed using the Garret method which involves dipping a mesh over the side of a boat and washing the material off with an appropriate solvent. The more hydrophobic material was then extracted and dried. The SSM was reconstructed in the lab on a Langmuir trough – a PTFE dish with an attached pressure sensor and movable barriers to sweep the material across the surface. This technique provides information on re-orientation and packing of the molecules at the surface, possible hysteresis effects, desorption of material into the bulk and the free energy at the surface. The Langmuir trough is set up under an ellipsometer – this employs an optical technique that measures the parameters Del and Psi which are the phase change and amplitude ratio of polarised light upon reflection of a surface. From these parameters it is possible to ascertain the refractive index, thickness of a film and with an imaging ellipsometer a visual representation of the arrangement of the molecules at the surface. Perpendicular to propagation in plane of incidence Del = phase difference of the polarised light on reflection Linearly polarised light Perpendicular to propagation parallel to surface * Psi = the amplitude ratio of the s and p components of the outgoing and incoming light Plane of incidence Pressure sensor Moveable barriers * Angle of incidence When 0° > 90° s and p are reflected differently Figure 1: diagram to show the experimental set up. Sea Surface Microlayer Results Seasonal Changes and Time Factors Isotherm Cycling and Hysteresis Effects Figure 3: graph showing images of the hysteresis effects of the SSM resulting from compression – expansion cycles. Figure 2: graph showing the changes in surface pressure of the SSM from different seasons as a function of time with images at t = 0 min and t = 60 min Discussion It can be seen that there are significant differences in the nature of the material found on the sea surface at difference times of the year. The material collected from Spring to Autumn looks quite similar differing mainly in quantity – shown by surface pressure values. This can be explained when considering primary production activity which begins in Spring, peaks in Summer and declines during Autumn. The images from Winter show material of a different nature, this is most likely refractory material from plankton which consist of large molecules that are harder to break down. The images of the isotherm cycling show that material on the surface (from Spring) becoming more organised and provides evidence of hysteresis effects that have only been hypothesised to date. Table 1: table showing the environmental differences during sample collection at different seasons and the amount of material collected Model Compound Results Surface Changes and Thickness Increases of Monolayers Upon Compression Discussion The results shown here demonstrate that it is possible to determine how the thickness of a monolayer increases as it is compressed. This gives an indication as to how the long hydrocarbon chains at the interface are organised. Images of the film also give more detail about these orientational changes by offering a visual representation. The combination of these 3 techniques, isotherms, imaging and spectroscopic ellipsometry yields valuable and detailed information about very thin films. 1.92 nm Film collapse 2.123 nm 1.930 nm 1.234 nm 1.313 nm 1.768 nm a a a b b b Figure 4: a) isotherm of C18 Phenylalanine with images of the monolayer at different surface pressures and the corresponding thickness of the film and b) diagram of the compound Figure 5: a) isotherm of C18 Phenylalanine methyl ester with images of the monolayer at different surface pressures and the corresponding thickness of the film and b) diagram of the compound Figure 6: a) isotherm of C18 Phenylalanine benzo 15-crown-5 with images of the monolayer at different surface pressures and the corresponding thickness of the film and b) diagram of the compound I would like to thank the EPSRC for providing funding for this project, the MOPED project for additional funding to enable sample collection, Lefteris Danos for allowing me time on his instruments and Bob Greef for his time and patience in making sense of my occasional confusion. For an online version of this poster please either photograph the QR code or visit http://eprints.soton.ac.uk/66222/