Download
1 / 35
360 likes | 513 Views
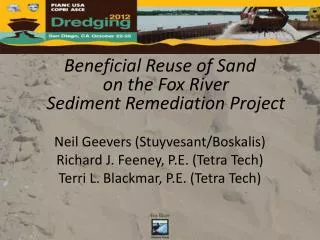
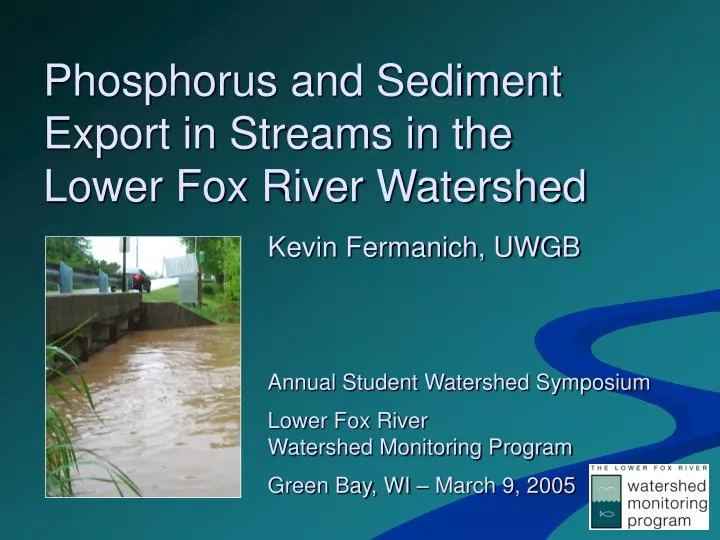
Phosphorus and Sediment Export in Streams in the Lower Fox River Watershed. Kevin Fermanich, UWGB. Annual Student Watershed Symposium Lower Fox River Watershed Monitoring Program Green Bay, WI – March 9, 2005. Cooperative, multi-year project started 2003

E N D
Phosphorus and Sediment Export in Streams in the Lower Fox River Watershed Kevin Fermanich, UWGB Annual Student Watershed Symposium Lower Fox River Watershed Monitoring Program Green Bay, WI – March 9, 2005
Cooperative, multi-year project started 2003 • Measure WQ and Biotic Integrity -- relate to watershed. • Improve ability to predict future impacts. • More informed decision making. July 19, 2003
Program Partners • UW-Green Bay • Natural and Applied Sciences • Cofrin Center for Biodiversity • UW-Milwaukee • US Geological Survey • GBMSD • Oneida Tribe • 5 High Schools • Arjo Wiggins Appleton, Inc.
#1 trib. to Lake Michigan and #3 to Great Lakes (6,400 mi2) Largest source of pollutants P Loads: ~540,000 kg/yr ~80% from runoff Lower Fox Basin ¼ P ½ TSS Mouth New London DePere Wrightstown Oshkosh Appleton Berlin Neenah/Menasha Fox-Wolf Basin: Why here?
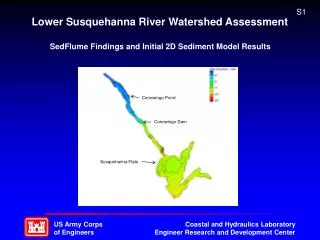
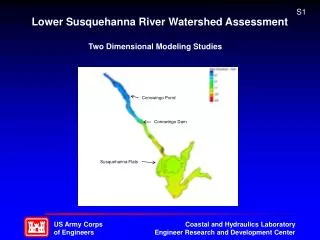
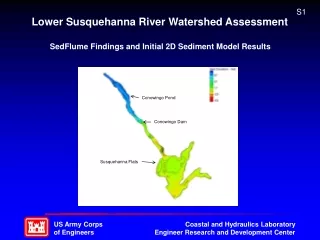
Lower Fox River Subbasin: Why Here? Estimated sediment yield Sediment Yield~ 0.25 mt/ha to Bay (Baumgart, 2000; SWAT modeling)
Major Program Elements • Continuous monitoring • Sediment & P loading (3 WY) • Real-time sensors • Source area studies • Watershed modeling • Stream biotic integrity monitoring • School-based monitoring program • hands-on learning, citizen scientists, meaningful data
How much? Where? What forms? Driving Factors? Impacts? Long-term Trends? What if? Basic Questions
School-Based Monitoring Program • Enhance student/teacher understanding of landscape and land use impacts on water quality and stream ecosystems. Structured to provide meaningful, long-term data: • Picture of existing conditions (Baseline) • Changing conditions over time (Trends) • Can be used by students, teachers, scientists and managers to answer questions about watershed dynamics and integrity. (Cause and effect relationships)
Objectives of Runoff Study • Quantify sediment and P concentrations and flow in 5 key Lower Fox River tributaries. • Estimate P and Sediment loads. • Determine the proportion of Dissolved P to Total P in runoff. • Link results to watershed characteristics and previous studies. • Refine/improve predictive capabilities.
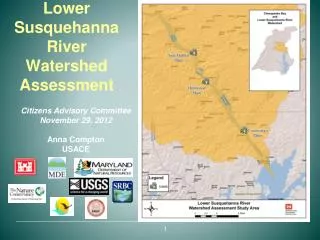
Monitoring Stations • 3 water years started Oct ‘03 • Watersheds • Duck Creek (CTH FF) • Baird Creek (at Superior Road (I-43)) • Apple Creek (CTH U) • Ashwaubenon Creek (Creamery Rd) • East River: GBMSD (Monroe St.)
Methods • Daily stage / flow • Low-flow / baseflow samples • Event Samplers • (~10 runoff events/year) • Total P, TSS • Total Dissolved P (25%) • TSS correlation with SSC • Precip. gauge network • Compute daily TP and sed. loads, and estimate DP loads
WY2004 Preliminary Results • Precipitation • Box plots of Concentration Data • DP/TP ratios • Loads and Yields
Precipitation This 10 inches WY 2004 = 813 mm (32 in.) NWS 30 yr = 741 mm (29 in.) 2nd wettest May on record
1988-2000 avg. streams in LFB Max 75% Median 25% Min 1988-2000 avg. Duck Creek Number of Samples TSS Conc.: All Samples(variability and range) ~2.5 times greater than median from previous studies.
1988-2000 avg. streams in LFB 1988-2000 avg. Duck Creek Total P Conc.: All Samples
Sediment and P Yields • ~0.75 mton/ha in clay soils watersheds (2000 land use SWAT modeling = 0.25 mton/ha). • ~2.5x avg. runoff load contribution to Green Bay from LFB.
Conclusions • Second wettest May on record; annual only +10% • Apple, Ash., Baird similar median TSS conc. (~126 mg/L) – 2.5x previous studies • TP median conc. 0.28 – 0.70 mg/L • TP > 2 mg/L at all sites • DP 40 to 54% of TP during events • > 72% DP during low flow • DP significant form of runoff P. Implications for BMPs? • Loads highly event driven • 13 days = 65% of annual P load in Apple Creek • High sediment and P yields
Conclusions • Are conditions improving? • Can we deal with big events at source areas? • Can we deal with dissolved P? Further analysis of watershed linkages and biotic integrity are ongoing.
1200 1000 ) R e a l - t i m e T u r b i d i t y s f c 800 T S S s a m p l e s ( e g T u r b i d i t y - d e r i v e d T S S r 600 a h c 400 s i D 200 0 1600 1000 1400 1200 800 ) 1000 U ) T L / N g 600 ( m y 800 t ( i d S i S b r T u 600 T 400 400 200 200 0 0 4/28/04 5/3/04 5/8/04 5/13/04 5/18/04 5/23/04 5/28/04 Turbidity-derived Sediment Concentrations TSS samples
Baird Creek Urbanization Study • Determine what impact the transition from ag. to urban land use is having on Baird Creek • Sediment and phosphorus conc. & loads • Evaluating stream biota populations
2000 Land Use Projected 2022
2000 Land Use 2004Land Use
Baird Creek Study Conclusions • TSS and Total P concentrations are significantly higher on the urbanizing tributary than on the agricultural tributary • Agricultural branch only contributes 30-40% of the sediment load during summer storm events • Thus, the urbanizing part of the watershed (< 20% of the area) is contributing 60-70% of the sediment load at the USGS station
Ongoing Plans • Continue event and low flow sampling and flow measurements through Sept. 2006 • SWAT modeling • Continue biotic monitoring through 2006 • School Monitoring: • Continue w/ current schools • Add school for Ashwaubenon Creek, others? • Build community linkages • Long-term funding
Acknowledgements Special thanks to the following people : • Dave Graczyk, Dale Robertson, Paul Reneau and Troy Rutter, U.S. Geological Survey • John Kennedy and Tracy Valenta, GBMSD • Paul Baumgart, UWGB • Jessie Fink, UWGB • Bud Harris, UWGB • Jon Habeck, UWGB • Arjo Wiggins Appleton, Inc.
www.uwgb.edu/watershed Satellite image May 19, 2000