Download
1 / 25
250 likes | 380 Views
Eye Movement Strategies In Navigational Tasks. Austin Ducworth Melissa Falzetta Lindsay Hyma Katie Kimble James Michalak. Introduction. Navigation involves keeping track of one’s current location and planning routes to new destinations. Maps are the most common navigational tool.

E N D
Eye Movement Strategies In Navigational Tasks Austin Ducworth Melissa Falzetta Lindsay Hyma Katie Kimble James Michalak
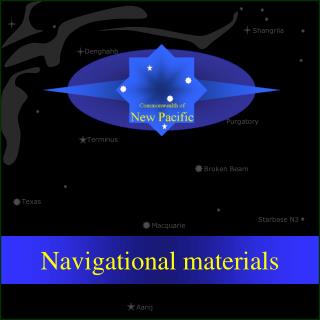
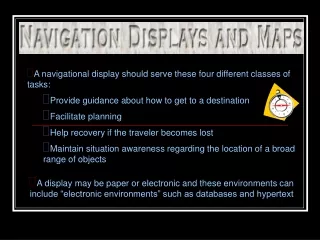
Introduction • Navigation involves keeping track of one’s current location and planning routes to new destinations. • Maps are the most common navigational tool. • Coordinating reference frames is a key difficulty in navigational tasks
Cardinal Direction Tasks • Prove to be more difficult than other navigational tasks • Prone to show wide individual differences in performance
Set-Up • Started w/ Dr. D’s GCI++ code. • Removed the pre-defined duration within the scenario (.tri) file. • Checked for a key press event for the operator to switch between images. • Modify the margins so the 640x299 and 350x340 images were centered within the 640x480 display window.
Analysis • Objective: We wanted to turn the raw coordinate and time data into interpretable output. • Problem: The analysis program included in Dr. D’s gci++ code overlaid the scanpath over the image, however, it did not show the eye movements in sequence
ANALYSIS Approach • Approach: Write a java application to read in por data and write the sequence of roi hits for each image.
ANALYSIS 1st Attempt • Parse through the por data and determine if the coordinate represent a point within pre-defined ROIs. • If a point lies within an ROI, a hit and the duration is recorded in an output file. • PROBLEMS: • Defining ROIs • Calibration • Inconclusive Results
ANALYSIS 2nd Attempt • Divide all points within the image into a grid of user specified proportions. • PROBLEMS: • Data Analysis Lengthy • Not Enough Testing
ANALYSIS 3rd Attempt • Analyze the scanpath using the analysis program. • PROBLEMS: • Sequence must be guestimated • ADVANTAGES: • Quick Analysis • Previously Tested Results • Ass Saving Technology
Experiment • Between subjects design • 2 strategies • Heading reference strategy • 3D First strategy • 8 participants (4 per condition) • Excluding 1 participant for failure to follow instructions
Design • Initial training • Strategy training • 24 practice trials • Eye movement trials
Eye Movement Trials • Individual map • Table knock Answer Screen
Analysis • Each scanpath was superimposed on its respective map • Analyzed eye movements • Looked for expected patterns to emerge
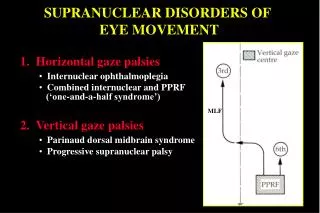
Analysis: Expected Patterns Heading Reference First expected to look at regions corresponding to the map arrow (regions 15 and 20) Then look at regions 2,7.or 12 to orient themselves on the 3D map. They look to the left and right of these regions (regions 6,11 and 7) to determine the direction of these parking lots 3D First • First look at region 12 and then to the parking lot with the cars (regions 16 or 17) to form an angle. • Then Transpose that angle to the right side of the map, mentally rotate the angle to coincide with the heading direction of the airplane (regions 15 and 20).
3D First Heading Ref.
Performance Results • Heading reference: 76.4% correct • 3-D First: 66.7% correct • Not a notable performance difference between strategies
Strategy Use Results • Heading Referencing: used strategy on 50% of trials. • 3-D First: used strategy on 74% of the trials. • One sample t-test: a significant number of participants did not use the strategy
Qualitative Observations • Some subjects did not have eye movements over the arrow showing airplane direction. • 3-D First strategy: Some subjects exhibited a visual angle formation in their scanpaths while others may have been forming an angle mentally rather than via eye movements
Discussion • Did not show a significant difference in performance depending on strategy used • Did not use strategy taught a significant percentage of time
Recommendations • Use a more objective strategy for data analysis • Use less training: more mistakes may give more insight into a superior strategy • Use more sensitive measures: response time