Download
1 / 11
110 likes | 216 Views
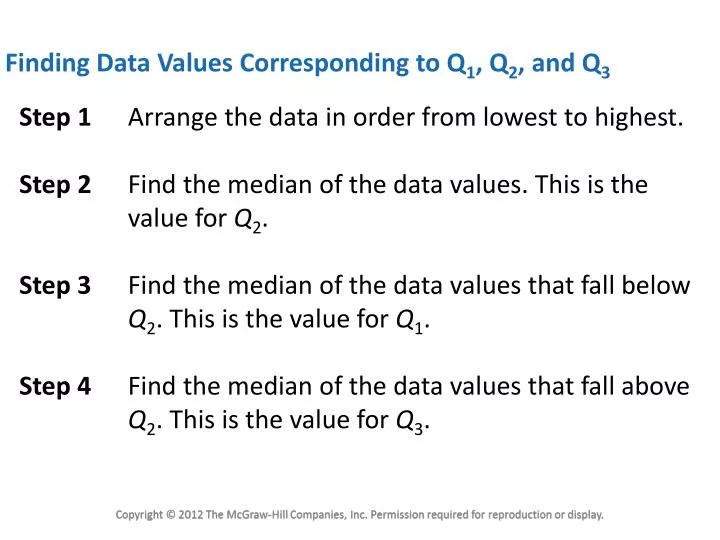
Step 1 Arrange the data in order from lowest to highest. Step 2 Find the median of the data values. This is the value for Q 2 . Step 3 Find the median of the data values that fall below Q 2 . This is the value for Q 1 .

E N D
Step 1 Arrange the data in order from lowest to highest. Step 2 Find the median of the data values. This is the value for Q2. Step 3 Find the median of the data values that fall below Q2. This is the value for Q1. Step 4 Find the median of the data values that fall above Q2. This is the value for Q3. 3.3 Measures of Position Finding Data Values Corresponding to Q1, Q2, and Q3
Example 3-36: Quartiles Find Q1, Q2, and Q3 for the data set. 15, 13, 6, 5, 12, 50, 22, 18 Sort in ascending order. 5, 6, 12, 13, 15, 18, 22, 50 Bluman Chapter 3
Measures of Position: Outliers • An outlier is an extremely high or low data value when compared with the rest of the data values. • A data value less than Q1 – 1.5(IQR) or greater than Q3 + 1.5(IQR) can be considered an outlier. Bluman Chapter 3
3.4 Exploratory Data Analysis • The Five-Number Summary is composed of the following numbers: Low, Q1, MD, Q3, High • The Five-Number Summary can be graphically represented using a Boxplot. Bluman Chapter 3
Constructing Boxplots • Find the five-number summary. • Draw a horizontal axis with a scale that includes the maximum and minimum data values. • Draw a box with vertical sides through Q1 and Q3, and draw a vertical line though the median. • Draw a line from the minimum data value to the left side of the box and a line from the maximum data value to the right side of the box. Bluman Chapter 3
Example 3-38: Meteorites The number of meteorites found in 10 U.S. states is shown. Construct a boxplot for the data. 89, 47, 164, 296, 30, 215, 138, 78, 48, 39 30, 39, 47, 48, 78, 89, 138, 164, 215, 296 Five-Number Summary: 30-47-83.5-164-296 Q1 Low MD Q3 High 47 83.5 164 296 30 Bluman Chapter 3