Download
1 / 21
210 likes | 366 Views
Chapter 11 Chi-Square Procedures. 11.1 Chi-Square Goodness of Fit. Characteristics of the Chi-Square Distribution 1. It is not symmetric. Characteristics of the Chi-Square Distribution 1. It is not symmetric.

E N D
Chapter 11Chi-Square Procedures 11.1 Chi-Square Goodness of Fit
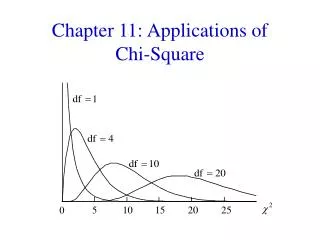
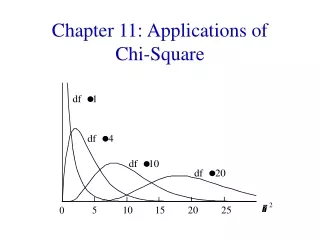
Characteristics of the Chi-Square Distribution 1. It is not symmetric.
Characteristics of the Chi-Square Distribution 1. It is not symmetric. 2. The shape of the chi-square distribution depends upon the degrees of freedom, just like Student’s t-distribution.
Characteristics of the Chi-Square Distribution 1. It is not symmetric. 2. The shape of the chi-square distribution depends upon the degrees of freedom, just like Student’s t-distribution. 3. As the number of degrees of freedom increases, the chi-square distribution becomes more symmetric as is illustrated in Figure 1.
Characteristics of the Chi-Square Distribution 1. It is not symmetric. 2. The shape of the chi-square distribution depends upon the degrees of freedom, just like Student’s t-distribution. 3. As the number of degrees of freedom increases, the chi-square distribution becomes more symmetric as is illustrated in Figure 1. 4. The values are non-negative. That is, the values of are greater than or equal to 0.
A goodness-of-fit test is an inferential procedure used to determine whether a frequency distribution follows a claimed distribution.
Expected Counts • Suppose there are n independent trials an experiment with k> 3 mutually exclusive possible outcomes. Let p1 represent the probability of observing the first outcome and E1 represent the expected count of the first outcome, p2 represent the probability of observing the second outcome and E2 represent the expected count of the second outcome, and so on. The expected counts for each possible outcome is given by • Ei = i = npi for i = 1, 2, …, k
EXAMPLE Finding Expected Counts A sociologist wishes to determine whether the distribution for the number of years grandparents who are responsible for their grandchildren is different today than it was in 2000. According to the United States Census Bureau, in 2000, 22.8% of grandparents have been responsible for their grandchildren less than 1 year; 23.9% of grandparents have been responsible for their grandchildren 1or 2 years; 17.6% of grandparents have been responsible for their grandchildren 3 or 4 years; and 35.7% of grandparents have been responsible for their grandchildren for 5 or more years. If the sociologist randomly selects 1,000 grandparents that are responsible for their grandchildren, compute the expected number within each category assuming the distribution has not changed from 2000.
Test Statistic for Goodness-of-Fit Tests Let Oi represent the observed counts of category i, Ei represent the expected counts of an category i, k represent the number of categories, and n represent the number of independent trials of an experiment. Then, i = 1, 2, …, k approximately follows the chi-square distribution with k – 1 degrees of freedom provided (1) all expected frequencies are greater than or equal to 1 (all Ei> 1) and (2) no more than 20% of the expected frequencies are less than 5. NOTE: Ei = npifor i = 1,2, ..., k.
The Chi-Square Goodness-of-Fit Test • If a claim is made regarding a distribution, we can use the following steps to test the claim provided • the data is randomly selected
The Chi-Square Goodness-of-Fit Test • If a claim is made regarding a distribution, we can use the following steps to test the claim provided • the data is randomly selected • 2. all expected frequencies are greater than or equal to 1.
The Chi-Square Goodness-of-Fit Test • If a claim is made regarding a distribution, we can use the following steps to test the claim provided • the data is randomly selected • 2. all expected frequencies are greater than or equal to 1. • 3. no more than 20% of the expected frequencies are less than 5.
Step 1: A claim is made regarding a distribution. The claim is used to determine the null and alternative hypothesis. Ho: the random variable follows the claimed distribution H1: the random variable does not follow the claimed distribution
Step 2: Calculate the expected frequencies for each of the k categories. The expected frequencies are npi for i = 1, 2, …, k where n is the number of trials and pi is the probability of the ith category assuming the null hypothesis is true.
Step 3: Verify the requirements fort he goodness-of-fit test are satisfied. • (1) all expected frequencies are greater than or equal to 1 (all Ei> 1) • (2) no more than 20% of the expected frequencies are less than 5.
EXAMPLE Testing a Claim Using the Goodness-of-Fit Test A sociologist wishes to determine whether the distribution for the number of years grandparents who are responsible for their grandchildren is different today than it was in 2000. According to the United States Census Bureau, in 2000, 22.8% of grandparents have been responsible for their grandchildren less than 1 year; 23.9% of grandparents have been responsible for their grandchildren 1or 2 years; 17.6% of grandparents have been responsible for their grandchildren 3 or 4 years; and 35.7% of grandparents have been responsible for their grandchildren for 5 or more years. The sociologist randomly selects 1,000 grandparents that are responsible for their grandchildren and obtains the following data.