Download
1 / 1
10 likes | 274 Views
Comparative mapping of Brassica oleracea using sequence-based markers derived from other Brassica relatives and transcriptome sequences generated from three parental lines using GS-FLX-Titanium.

E N D
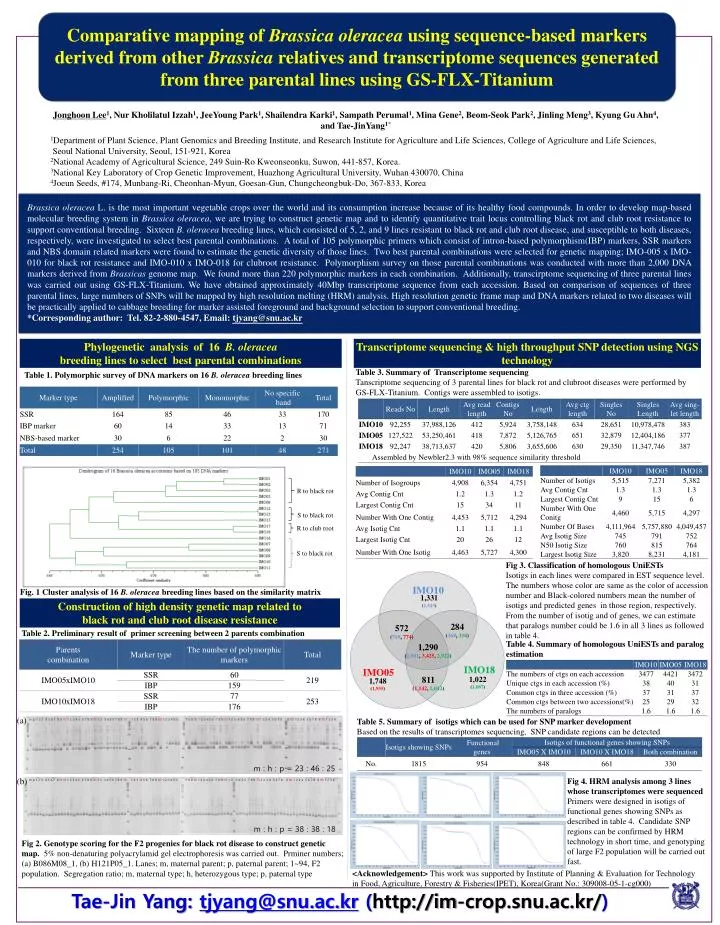
Comparative mapping of Brassica oleracea using sequence-based markers derived from other Brassica relatives and transcriptome sequences generated from three parental lines using GS-FLX-Titanium • Jonghoon Lee1, NurKholilatul Izzah1, JeeYoung Park1, Shailendra Karki1, Sampath Perumal1, Mina Gene2, Beom-Seok Park2, Jinling Meng3, Kyung Gu Ahn4, and Tae-JinYang1* 1Department of Plant Science, Plant Genomics and Breeding Institute, and Research Institute for Agriculture and Life Sciences, College of Agriculture and Life Sciences, Seoul National University, Seoul, 151-921, Korea 2National Academy of Agricultural Science, 249 Suin-Ro Kweonseonku, Suwon, 441-857, Korea. 3National Key Laboratory of Crop Genetic Improvement, Huazhong Agricultural University, Wuhan 430070, China 4Joeun Seeds, #174, Munbang-Ri, Cheonhan-Myun, Goesan-Gun, Chungcheongbuk-Do, 367-833, Korea Brassica oleraceaL. is the most important vegetable crops over the world and its consumption increase because of its healthy food compounds. In order to develop map-based molecular breeding system in Brassica oleracea, we are trying to construct genetic map and to identify quantitative trait locus controlling black rot and club root resistance to support conventional breeding. Sixteen B. oleracea breeding lines, which consisted of 5, 2, and 9 lines resistant to black rot and club root disease, and susceptible to both diseases, respectively, were investigated to select best parental combinations. A total of 105 polymorphic primers which consist of intron-based polymorphism(IBP) markers, SSR markers and NBS domain related markers were found to estimate the genetic diversity of those lines. Two best parental combinations were selected for genetic mapping; IMO-005 x IMO-010 for black rot resistance and IMO-010 x IMO-018 for clubroot resistance. Polymorphism survey on those parental combinations was conducted with more than 2,000 DNA markers derived from Brassicas genome map. We found more than 220 polymorphic markers in each combination. Additionally, transcirptome sequencing of three parental lines was carried out using GS-FLX-Titanium. We have obtained approximately 40Mbp transcriptome sequence from each accession. Based on comparison of sequences of three parental lines, large numbers of SNPs will be mapped by high resolution melting (HRM) analysis. High resolution genetic frame map and DNA markers related to two diseases will be practically applied to cabbage breeding for marker assisted foreground and background selection to support conventional breeding. *Corresponding author: Tel. 82-2-880-4547, Email: tjyang@snu.ac.kr Transcriptomesequencing & high throughput SNP detection using NGS technology Phylogenetic analysis of 16 B. oleracea breeding lines to select best parental combinations Table 3. Summary of Transcriptome sequencing Tanscriptome sequencing of 3 parental lines for black rot and clubroot diseases were performed by GS-FLX-Titanium. Contigswere assembled to isotigs. Table 1. Polymorphic survey of DNA markers on 16 B. oleraceabreeding lines S to black rot R to club root Fig 3. Classification of homologous UniESTs Isotigs in each lines were compared in EST sequence level. The numbers whose color are same as the color of accession number and Black-colored numbers mean the number of isotigs and predicted genes in those region, respectively. From the number of isotig and of genes, wecan estimate that paralogs number could be 1.6 in all 3 lines as followed in table 4. R to black rot IMO10 Fig. 1 Cluster analysis of 16 B. oleraceabreeding lines based on the similarity matrix 1,331 (1,525) Construction of high density genetic maprelated to black rot and club root disease resistance S to black rot 284 (369, 334) 572 (719, 774) Table 2. Preliminary result of primer screening between 2 parents combination Table 4. Summary of homologous UniESTs and paralog estimation 1,290 (2,901, 3,425, 2,922) IMO18 IMO05 811 (1,142,1,042) 1,022 (1,087) 1,748 (1,935) (a) Table 5. Summary of isotigs which can be used for SNP marker development Based on the results of transcriptomes sequencing, SNP candidate regionscan be detected m p 1 2 3 4 5 6 7 8 9 10 1 2 3 4 5 6 7 8 9 20 1 2 3 4 5 6 7 8 9 30 1 2 3 4 5 6 7 8 9 40 1 2 3 4 5 6 7 8 9 50 1 2 3 4 5 6 7 8 9 60 1 2 3 4 5 6 7 8 9 70 1 2 3 4 5 6 7 8 9 80 1 2 3 4 5 6 7 8 9 90 1 2 3 4 m : h : p = 23 : 46 : 25 (b) Fig 4. HRM analysis among 3 lines whose transcriptomes were sequenced Primers were designed in isotigs of functional genes showing SNPs as described in table 4. Candidate SNP regions can be confirmed by HRM technology in short time, and genotyping of large F2 population will be carried out fast. m p 1 2 3 4 5 6 7 8 9 10 1 2 3 4 5 6 7 8 9 20 1 2 3 4 5 6 7 8 9 30 1 2 3 4 5 6 7 8 9 40 1 2 3 4 5 6 7 8 9 50 1 2 3 4 5 6 7 8 9 60 1 2 3 4 5 6 7 8 9 70 1 2 3 4 5 6 7 8 9 80 1 2 3 4 5 6 7 8 9 90 1 2 3 4 m : h : p = 38 : 38 : 18 Fig 2. Genotype scoring for the F2 progenies for black rot disease to construct genetic map. 5% non-denaturing polyacrylamid gel electrophoresis was carried out. Prminer numbers; (a) B086M08_1, (b) H121P05_1. Lanes; m, maternal parent; p, paternal parent; 1~94, F2 population. Segregation ratio; m, maternal type; h, heterozygous type; p, paternal type <Acknowledgement> This work was supported by Institute of Planning & Evaluation for Technology in Food, Agriculture, Forestry & Fisheries(IPET), Korea(Grant No.: 309008-05-1-cg000) Tae-Jin Yang: tjyang@snu.ac.kr (http://im-crop.snu.ac.kr/)