Download
1 / 31
310 likes | 417 Views
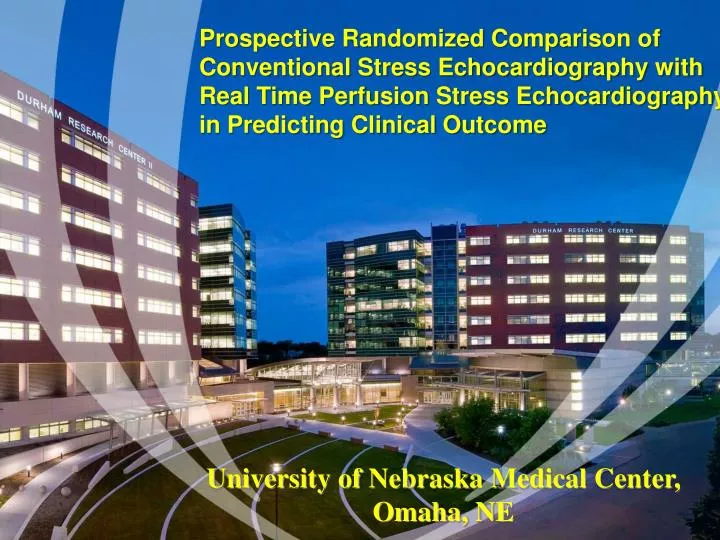
Prospective Randomized Comparison of Conventional Stress Echocardiography with Real Time Perfusion Stress Echocardiography in Predicting Clinical Outcome . University of Nebraska Medical Center, Omaha, NE. Disclosure. Thomas R Porter, MD has the following conflict of interests to disclose:

E N D
Prospective Randomized Comparison of Conventional Stress Echocardiography with Real Time Perfusion Stress Echocardiography in Predicting Clinical Outcome University of Nebraska Medical Center, Omaha, NE
Disclosure • Thomas R Porter, MD has the following conflict of interests to disclose: • Grant Support – General Electric Global Healthcare; Astellas Pharma, Inc., Lantheus Medical Imaging, Philips Healthcare • Equipment Support – Philips Healthcare • GE Global Healthcare
Background • Conventional Stress Echocardiography (CSE): • Compares wall motion during rest and stress echocardiography • Ultrasound contrast • Used for FDA Approved Indication • 2 or more contiguous segments not visualized
Real time Myocardial Contrast Echo (RTMCE) • Improve left ventricular opacification • Real time myocardial perfusion • Perfusion and Wall Motion • Improves Detection of CAD • Improves Predictive Power of Stress Echo • No prospective comparison with conventional stress echo (CSE) performed.
Objective • Prospectively compare the ability of CSE and RTMCE to predict outcome of patients referred for suspicion of coronary artery disease, and who are at intermediate risk
Secondary Objectives • Determine what effect RTMCE and CSE had on prediction of revascularization, death, or non-fatal MI • Determine what effect training experience with contrast imaging had on the predictive value of either CSE or RTMCE.
Study Design Six Month Intervals
Exclusion Criteria • Hypersensitivity to Ultrasound Contrast Agent • Pregnant or breast feeding • Low probability of CAD • Ventricular Paced Rhythm/Pacemaker Dependent
Methods • For RTMCE and CSE (when indicated) • Definity (Lantheus Medical ) • 3% intravenous continuous infusion at 4 to 6 ml/min under resting conditions and during stress
Real Time MCE • Siemens Acuson Sequoia (Contrast Pulse Sequencing) • Philips iE 33 or Sonos 5500 system (Power Modulation
Conventional Stress EchoCSE High mechanical Index Harmonic Imaging (60 Hz) Intermediate MI (If Reduced Visualization in Two Contiguous Segments
Image Analysis17 segment model • CSE and RTMCE • Wall motion (CSE) • Perfusion and wall motion (RTMCE) • analyzed simultaneously during the replenishment phase of contrast following brief high MI impulses • Normal • four seconds replenishment during rest • two seconds during stress
A2C Pre Flash Immediate post flash 1 second post flash 2 second post flash
Five Independent Reviewers • Experienced Reviewer (R1)-interpreted>1000 contrast studies for left ventricular opacification and perfusion • Less Experienced Reviewers (R2; n=4) Interpreted >100 contrast studies for left ventricular opacification and perfusion
Study end point • Primary end point: Death or non-fatal MI • Revascularization: Time Dependent Co-variate • Secondary end point: death, non-fatal MI, and subsequent revascularization
Statistical Analysis • Patient characteristics • compared with chi-square tests, or t-tests as appropriate • Survival distributions • Kaplan and Meier estimates • log-rank test. • Cox proportional hazards regression • univariate/multivariate predictors • Full multivariate and backward selected model
CSE/RTMCE Combined Event-free Survival Death/Non Fatal MI 1.0 0.9 0.8 0.7 0.6 Proportion 0.5 Test: p=0.038 0.4 0.3 0.2 0.1 0.0 0 1 2 3 4 5 Years Test result CENSOR FAIL TOTAL MEDIAN Normal RTMCE or CSE 1451 62 1513 . Abnormal RTMCE or CSE 497 36 533 4.55
Event-free Survival In patients with an Abnormal RTMCE vs CSE 1.0 0.9 0.8 0.7 0.6 Proportion 0.5 Test: p=0.88 0.4 0.3 0.2 0.1 0.0 0 1 2 3 4 5 Years Technique used CENSOR FAIL TOTAL MEDIAN CSE 209 15 224 4.55 . RTMPE 288 21 309
Event-free Survival In patients with a Normal RTMCE vs CSE 1.0 0.9 0.8 0.7 0.6 Proportion 0.5 Test: p=0.87 0.4 0.3 0.2 0.1 0.0 0 1 2 3 4 Years Technique used CENSOR FAIL TOTAL MEDIAN 769 33 802 CSE . RTMPE 682 29 711 .
RTMCE –Resting Wall Motion Abnormality 1.0 0.9 0.8 0.7 0.6 Proportion 0.5 Test: p<0.001 0.4 0.3 0.2 0.1 0.0 0 1 2 3 4 5 Years RWMA CENSOR FAIL TOTAL MEDIAN Negative 846 34 880 . Positive 128 16 144 .
CSE- Resting Wall Motion Abnormality 1.0 0.9 0.8 0.7 0.6 Proportion 0.5 Test: p=0.71 0.4 0.3 0.2 0.1 0.0 0 1 2 3 4 5 Years RWMA CENSOR FAIL TOTAL MEDIAN Negative 876 41 917 . Positive 108 7 115 4.55
Event-free survival, Less Experienced Reviewers Event-free survival, Experienced Reviewer Death/Non Fatal MI Death/Non Fatal MI 1.0 1.0 0.9 0.9 0.8 0.8 0.7 0.7 0.6 0.6 Proportion Proportion 0.5 0.5 Test: p=0.011 Test: p=0.73 0.4 0.4 0.3 0.3 0.2 0.2 0.1 0.1 0.0 0.0 5 2 3 4 0 1 0 1 2 3 4 5 Years Years Test result CENSOR FAIL TOTAL Test result CENSOR FAIL TOTAL MEDIAN . 28 880 908 . 571 34 605 Normal RTMCE or CSE Normal RTMCE or CSE . 12 195 183 Abnormal RTMCE or CSE Abnormal RTMCE or CSE 338 24 314
Secondary End Point Normal CSE vs Normal RTMCE Abnormal CSE vs Abnormal RTMCE 1.0 1.0 0.9 0.9 0.8 0.8 0.7 0.7 Proportion 0.6 0.6 0.5 0.5 Test: p=0.85 0.4 Proportion 0.4 Test: p=0.0045 0.3 0.3 0.2 0.2 0.1 0.1 0.0 0.0 0 1 2 3 4 0 1 2 3 4 Years Years Technique used CENSOR FAIL TOTAL MEDIAN Technique used CENSOR FAIL TOTAL MEDIAN . CSE . 732 50 782 CSE 178 45 223 . . 658 41 699 RTMPE RTMPE 211 95 306
Summary • Abnormal studies are more frequently detected with RTMCE when compared to CSE, and more frequently lead to revascularization • A resting wall motion abnormality during RTMCE is the most powerful predictor of outcome • Negative predictive value of a dobutamine or exercise SE, when performed with RTMCE versus CSE, is not different.
Limitations • Reviewer experience/training • Critical for contrast use for CSE and RTMCE • CSE results may be different if contrast not utilized. • Contrast Use was >60% for CSE in this study • Baseline Differences Between Groups
Conclusions • Both RTMCE and CSE (with 60% contrast use) have excellent negative predictive value • RTMCE –Combined Perfusion and WM • Can detect high risk patients • Potentially Alter Their Outcome