Download
1 / 1
10 likes | 109 Views
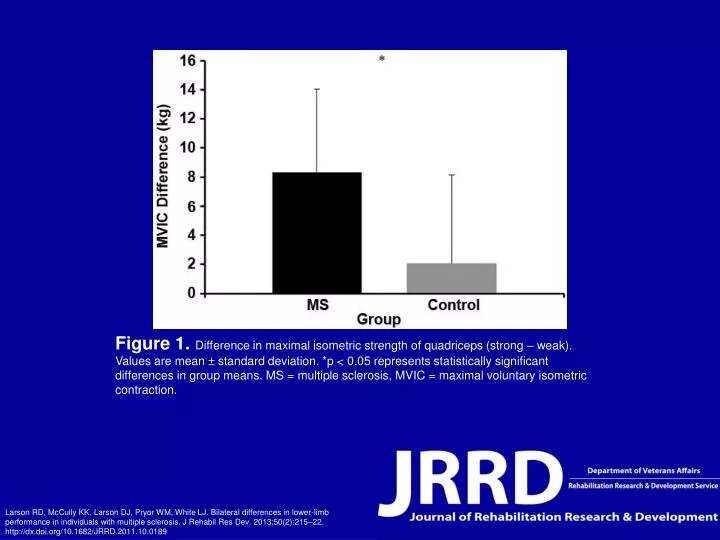
Figure 1. Difference in maximal isometric strength of quadriceps (strong – weak). Values are mean ± standard deviation. *p < 0.05 represents statistically significant differences in group means. MS = multiple sclerosis, MVIC = maximal voluntary isometric contraction.

E N D
Figure 1. Difference in maximal isometric strength of quadriceps (strong – weak). Values are mean ± standard deviation. *p < 0.05 represents statistically significant differences in group means. MS = multiple sclerosis, MVIC = maximal voluntary isometric contraction. Larson RD, McCully KK, Larson DJ, Pryor WM, White LJ. Bilateral differences in lower-limb performance in individuals with multiple sclerosis. J Rehabil Res Dev. 2013;50(2):215–22. http://dx.doi.org/10.1682/JRRD.2011.10.0189