Download
1 / 5
50 likes | 67 Views
This study presents fluorescence microscopy images of cultures enriched with TAO100 and provides phylogenetic analysis and comparative genomics of TAO100 and related strains. The results reveal the distribution of common and unique open reading frames among TAO100, Nitrosococcus halophilus, Nitrosococcus oceani, and Nitrosococcus watsonii.

E N D
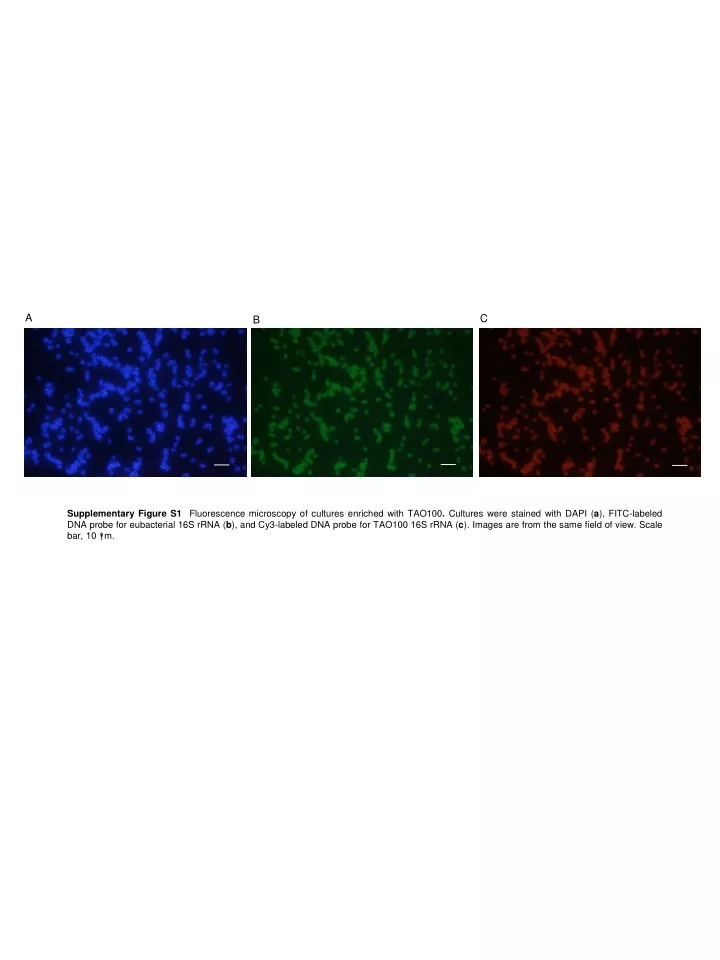
A C B Supplementary Figure S1 Fluorescence microscopy of cultures enriched with TAO100. Cultures were stained with DAPI (a), FITC-labeled DNA probe for eubacterial 16S rRNA (b), and Cy3-labeled DNA probe for TAO100 16S rRNA (c). Images are from the same field of view. Scale bar, 10 mm.
Nitrosococcus watsonii C-113 AF153343 Nitrosococcus oceani ATCC19707 NC007484 100 93 Nitrosococcus halophilus Nc4 AF287298 100 TAO100 Thiocapsa roseatype DSM235T AJ002798 53 77 Thiolamprovum pedioforme DSM3802 Y12297 Chromatium okenii DSM169 AJ223234 Rhabdochromatium marinum X84316 100 Halochromatium salexigens 6310T X98597 100 56 Thiorhodovibrio winogradskyistrain SSP1AJ006214 Nitrococcus mobilis ATCC25380 L35510 54 86 Arhodomonas aquaeolei ATCC49307 M26631 99 Halorhodospira halophila M26630 Thioalcalovibrio denitrificans AF126545 Methylomonas methanica MC09 AEF98753 60 65 Thiorhodospira sibirica AT12 AJ006530 94 Methylosarcina lacus WP024298805 99 Ectothiorhodospira mobilisDSM237X93481 99 Methylomarinovum caldicuralii BAF62078 92 Ectothiorhodospira shaposhnikovi M59151 TAO100 60 Thiobacillus halophilus U58020 Nitrosococcus halophilus WP013031750 80 100 Halothiobacillus hydrothermalis M90662 Nitorsococcus watsonii C-113 AAF03938 94 Halothiobacillus neapolitanus DSM581 AF173169 100 93 Nitrosococcus oceani ATCC19707 AAB57809 100 93 Halothiobacillus kellyi AF170419 Methylocystis sp.SC2CCJ05654 Acidithiobacillus thiooxidans strainATCC19377 AJ459803 Thermithiobacillus tepidarius DSM3134AJ459801 Methylosinus trichosporium OB3b AAA87220 71 Methylocapsa acidiphila CAJ01617 59 0.02 Nitrosomonas eutropha C91ABI60300 100 Nitrosomonas europaea ATCC19718 CAD84855 Nitrosospira multiformis ATCC25196ABB76052 100 Nitrosospira briensis C-128 AAB38709 99 Nitrosopumilus maritimus SCM1 ABY89139 0.2 Chromatiaceae a Ectothiorhodospiraceae Halothiobacillaceae Acidothiobacillales b Gammaproteobacteria PmoA Gammaproteobacteria AmoA Alphaproteobacteria PmoA Betaproteobacteria AmoA Supplementary Figure S2 Phylogenetic relationships of TAO100 and related strains. (a) Phylogenetic relationships of TAO100, three g-AOB isolates, and relatives from three families in order Chromatiales and class Gammaproteobacteria, as inferred from 16S rRNA gene sequences (ca.1500 bp). (b) Phylogenetic relationships among amino acid sequences (165 residues) of ammonia monooxygenase subunit A (AmoA) and methane monooxygenase subunit A (PmoA). Trees were constructed using the neighbor-joining algorithm with Kimura two-parameter correction. Marked nodes are supported by bootstrap values greater than 45% by neighbor-joining. Scale bar, 0.02 nucleotide (a) and 0.2 amino acid (b) change per position.
a TAO100 b Supplementary Figure S3 Genome features of TAO100. (a) Circulars representation of the TAO100 chromosome and plasmid pTAO101. The distribution of CDSs is depicted by colored boxes according to the functional category of the KEGG modules and the direction of transcription (the outer circle is the plus strand; the inner circle is the minus strand.Light gray, KEGG Orthology (KO) not assigned in pathway; light purple, cellular processes; dark blue, environmental information processing; gray, no KO assigned; yellow-green, genetic information processing; tan, human diseases; black, hypothetical; light pink, metabolism; light orange, organismal systems; light blue, cellular processes, environmental information processing). The third and fourth circles indicate the distribution of rRNA and tRNA in the genome, respectively. (b) Table depicting the genome features of TAO100 and genome-sequenced AOB. Data were obtained from NCBI genome data base (http://www.ncbi.nlm.nih.gov/genome/genomes/).
N. oceani N. watsonii N. halophilus TAO100 Supplementary Figure S4 Venn diagram depicting the distribution of common and unique open reading frames (ORFs) among TAO100, N. halophilus, N. oceani and N. watsonii. Only complete protein-coding ORFs, including hypothetical unknowns, are included. The IS element, phage ORFs, and pseudogenes are excluded.
TAO100 N.halophilus N. oceani N.watosoni TAO100 N.halophilus N. oceani N.watosoni TAO100 N.halophilus N. oceani N.watosoni TAO100 N.halophilus N. oceani N.watosoni TAO100 N.halophilus N. oceani N.watosoni TAO100 N.halophilus N. oceani N.watosoni TAO100 N.halophilus N. oceani N.watosoni TAO100 N.halophilus N. oceani N.watosoni TAO100 N.halophilus N. oceani N.watosoni TAO100 N.halophilus N. oceani N.watosoni TAO100 N.halophilus N. oceani N.watosoni TAO100 N.halophilus N. oceani N.watosoni TAO100 N.halophilus N. oceani N.watosoni TAO100 N.halophilus N. oceani N.watosoni Supplementary Figure S5 Comparative genome analysis of TAO100. Alignment of the core genomes of TAO100 and three halophilic g-AOB belonging to the genus Nitrosococcus. Rows and columns represent genomes and orthologous groups, respectively. A black line indicates adjacent groups. A green line indicates non-adjacent neighbors (i.e., insertions are present), and a red line represents inversion. A total of 2,241 orthologous genes common to half of four strains were identified using MBGD.