Download
1 / 67
870 likes | 1.75k Views
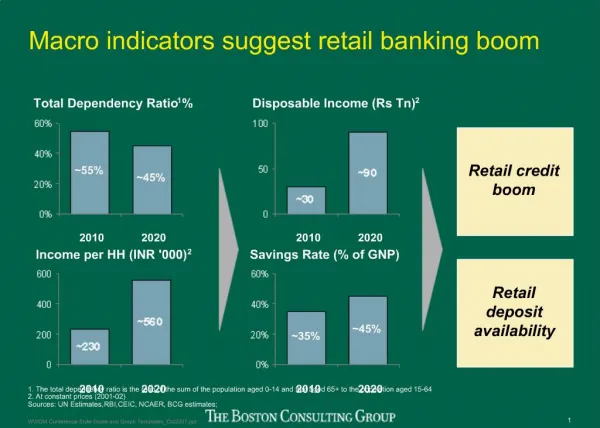
Retail Banking Presentation. Banorte Day Miguel Huller Director General de Consumo. November 16, 2007. Contents. Market Overview Retail Lending Deposits Electronic Banking. Retail Banking – Overview. Credit Card. Mortgage. Retail Lending Evolution. Source: Banxico.

E N D
Retail Banking Presentation Banorte Day Miguel Huller Director General de Consumo November 16, 2007.
Contents • Market Overview • Retail Lending • Deposits • Electronic Banking
Retail Banking – Overview Credit Card Mortgage Retail Lending Evolution Source: Banxico Retail lending portfolio in O/S Retail lending had a dramatic growth at a CAGR of 39 % in the last years….. Mortgage and Credit Cards O/S 500,000 450,000 400,000 … and the major drivers were mortgages and credit cards growing at CAGR of 27% and 47 % respectively 350,000 300,000 250,000 200,000 150,000 100,000 50,000 - 2000 2001 2002 2003 2004 2005 2006 2007 P$ Million
Retail Banking – Overview TIIE 28 Days Average Annual Inflation Retail Lending Evolution Source: Banxico GDP per Capita in US$ Also, the GDP per capita has grown…. TIIE 28 Days Average Annual vs. Inflation 18% 17.0% 16% … and inflation and interest rate have gone down. 14% 12.8% 12% 9.6% 10% 8.7% 8.2% 7.6% 7.5% 8% 7.2% 6.8% 5.7% 5.2% 6% 4.4% 4.0% 4.1% 3.4% 3.3% 4% 2% 0% 2000 2001 2002 2003 2004 2005 2006 2007E
Retail Banking – Overview Retail Lending Evolution Comparison betwen Mortgage Loans
Retail Banking – Overview 4.3% 4.5% 4.1% 4.0% 3.5% 3.0% 3.0% 2.5% 2.1% 2.0% 1.6% 1.5% 1.2% 1.0% 1.0% 0.8% 0.5% 0.0% 2000 2001 2002 2003 2004 2005 2006 1T07 Retail Lending Evolution Non guaranteed loans as a % of GDP Non guaranteed loans have grown as a percentage of the GDP … Non guaranteed loans as a % of GDP (2005) 18% 15.9% 16% 14.3% 14% 11.4% 12% 10.8% 9.6% 10% … but they are still way below other countries 8.0% 8% 6.5% 6% 4.5% 3.4% 3.1% 3.0% 3.0% 4% 2% 0% UK Italy USA Sweden Spain Turkey France Mexico Hungary Portugal Holland Germany
Retail Banking – Overview Retail Lending Evolution Bank Mortgages as a % of GDP Mortgages have also grown but with a lower share….. Mortgage as a % of GDP (2005) 70% 65% 61% 60% 50% 43% … still, it is dramatically below developed countries and other LA countries 40% 29% 30% 20% 16% 7% 10% 1.5% 2% 0% UK EEUU European France Chile Mexico Mexico Brazil union (banks)
Retail Banking – Overview Retail Enterprises Affluent Corporate and Government Middle Market Middle Market SME Entry Level
Retail Banking – Overview (9M 2007) % Revenue/ Total GFNorte: • Mortgage • Car Loan • Payroll / Personal Loan • Credit Card 26% • ATM • POS/Debit • Internet Banking • Telephone Banking • Mobile Banking • Retail & Commercial: • Checking accounts • Saving accounts • Payroll accounts • Cash management % Revenue/ Total GFNorte: 7% % Revenue/ Total GFNorte: 32%
Retail Lending Retail Lending Represents 37% of Banorte’s Total Outstandings with P$ 60 (Billions) (9M 2007) ROA: 3.1% Banorte: ROA: 1.8%
Retail Lending Distribution of Outstandings by Type of Loan (9M 2007)
Mortgage Banorte has a Mortgage solution for every customer need… 87% • Residential acquisition • Home Equity • Debt consolidation • Construction and renovation • Land acquisition • Commercialacquisition 8% 5% … with great features and benefits
Mortgage Distribution of sales by Channel in outstandings 2004 Branches 2007 Mortgage Centres Brokers Branches
Mortgage CAGR = 27.4 % Mortgage Sales in P$ (Billions) Average loan in P$: 667,800 Banks’ average mortgage in P$: 609,000 Average loan period: 212 Months
Mortgage CAGR = 21.9 % Total Year End Outstandings in P$ (Billions) * * * Growth considering the sale of FOVISSSTE portfolio and Securitization.
Mortgage Past Due Loan Ratio by Booking year in P$ (Millions) PDLR Year Booked Outstandings Banorte before 1997 115 19.2% Bancrecer 1,222 8.4% Banorte after 1997 30,744 1.2% 32,081 2.4% Total
Mortgage Past Due Loan Ratio by property value in P$ (Millions) Outstandings PDLR Property Value % Less than 300,000 1,168 3.6% 2.0% 300,000 - 500,000 3,648 11.4% 1.2% 500,000 - 700,000 5,853 18.2% 0.9% 700,000 - 900,000 3,868 12.1% 1.2% More than 900,000 17,543 54.7% 1.3% 100% 32,081 Total 1.2%
Mortgage Past Due Loan Ratio by Bank (Source: Mexican Bank Association) PDLR 6.2% PDLR 3.0% HSBC Scotia BBVA Banamex Banorte Santander
Mortgage Present and future: Key success factors Meet our costumers needs, with asset quality in a highly competitive Mexican mortgage market… Innovation: new products and features Efficient credit adjudication process Conservative risk management policies Long term customer relationship Strong relationship with developers
Mortgage Market sales 07 (%) Avg. Market Share $40,895 75% 10.0% Market sales 07 (%) Avg. Market Share 21.0% $11,169 20% Market sales 07 (%) Avg. Market Share $2,174 5% 19.0% Present and Future Key Success Factors Regional Strategy by market potential Monterrey Mexico City Guadalajara Strategies Expected Intensive High Growth Moderate Mantain & Moderated Growth Medium Moderated Growth Figures in Million pesos (P$) Mexican Bankers Association
Car Loan CAGR = 6.4 % Total Year End Outstandings in P$ (Billions)
Car Loan CAGR = 8.6 % Car loan Sales in P$ (Billions) Average loan in P$ 171,000 Industry’s Average Loan in P$ 142,000 Average loan period: 46 Months
Car Loan Car sales by segment 2007e
Car Loan Car Loans as a % of new cars sold in México 2005 2006 2007e Dealer Loans 58% 59% 58% Bank Loans 31% 32% 35% Self financing 10% 8% 7%
Car Loan Past Due Loan ratio by bank (Source: Mexican Bank Association) PDLR 2.8% PDLR 2.0% BBVA Banamex HSBC Scotia Banorte
Car Loan Present and future: Key success factors • Target: high value cars and enterprises • Special sales force for car dealers • Special offer for existing clients to trade up their cars • Attach car loans to payroll accounts to leverage • on asset quality • Launch new products: leasing • Improvement in credit adjudication process
Payroll & Personal Loan CAGR = 36.3 % Total Year End Outstandings in P$(Billions)
Payroll & Personal Loan CAGR = 29.2 % Payroll and Personal Sales in P$ (Billions) Average loan in P$ 22,576 Industry’s Average Loan in P$ 13,000 Average loan period: 23 Months
Payroll & Personal Loan % Payroll Loans / Payroll Accounts (Thousand Units) Payroll Accounts (Units) Payroll Loans (Units) % Loans / Accounts Year Estimated growth of 358,000 net new payrollaccounts for 2008
Payroll & Personal Loan Past Due Loan ratio by bank (Source: Mexican Bank Association) PDLR 2.3% PDLR 2.0% HSBC Scotia BBVA Banamex Banorte Santander
Payroll & Personal Loan Present And Future: Key Success Factors Existing Clients • Migrate customer mindset from fixed term loan to line • of credit • Diversify credit disbursement channels from • branches ATM and internet banking • New products and offers for first timers. • Channel diversification : sales force on site clients • Cross selling / pre-authorized credits New Clients
Credit Card CAGR = 56.4 % Cards Sold in Thousand
Credit Card Cards Portfolio in Thousand CAGR = 57.1 %
Credit Card Sales ChannelDiversification Branches Telemarketing Crossin selling Balance Tranfers Program Suplementary Cards
Credit Card CAGR = 26% Purchases & Cash Advances in P$ (Billions) Market Share: 5.0 % as of Sep 07 from 4.6 % Sep 06
Credit Card Total Year End Outstandings in P$ (Billions) 13 10 7 4 CAGR = 48.1 %
Credit Card Product Mix Credit Limit in P$ Credit Limit in P$ Retail Enterprises Infinite $ 250,000 Platinum Corporate $ 40,000 Gold Standard Mujer $ 200,000 $ 10,000 SME Classic Standard Instant Issuing $ 6,000 Entry Level $ 3,000 New Products
Credit Card Past Due Loan Ratio by Bank (Source: Mexican Bank Association) PDLR 6.3% PDLR 2.8% HSBC Scotia BBVA Banamex Banorte Santander 90+ 60+
Credit Card Credit Cards in México (Source: Mexican Credit Bureau) 35.9 millions cards (sept 07) 2.46 cards per client Past Due Loan Ratio (90+)
Credit Card Present and Future : Key Success Factors Sales channel diversification & consolidation Portfolio management Product development / Co-branded cards Balance transfers / Convenience checks Credit Risk Management / Risk based pricing Technological & operational efficiencies
Credit Card Present and Future : Key Success Factors Cards Market Market size (%) Avg. Market Share 21.6 83% 3.5% Market size (%) Avg. Market Share 11.1% 3.5 13% Market size (%) Avg. Market Share 0.9 4% 5.6% Monterrey Mexico City Guadalajara Strategies Expected Intensive High Growth Moderate Mantain & Moderated Growth Medium Moderated Growth
Deposits Total Number of Local Currency Account (millions) CAGR = 25.4%
Deposits CAGR = 11.9 % Total Year End Balances in P$ (Billions)
Deposits Average Funding Cost (As a % of CETES 28) (Source: Mexican Bank Association)