Download
1 / 29
290 likes | 299 Views
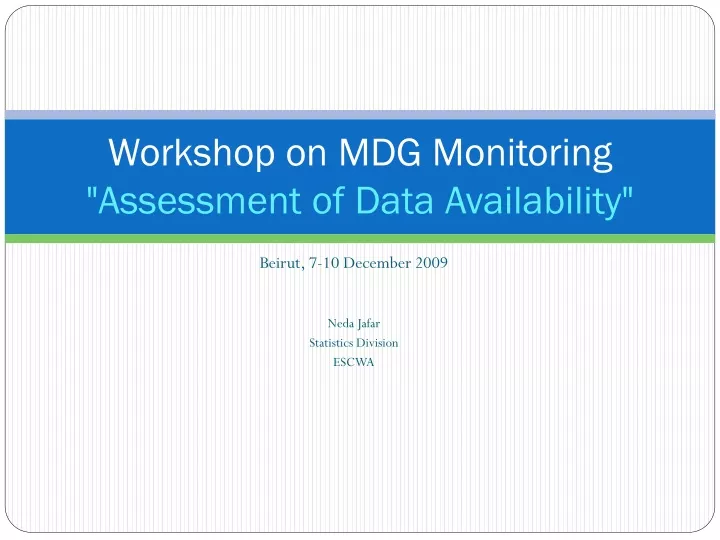
Workshop on MDG Monitoring "Assessment of Data Availability". Beirut, 7-10 December 2009 Neda Jafar Statistics Division ESCWA. Availability of data Discrepancy of data ESCWA strategy Part I – current activities Part II – future plans.

E N D
Workshop on MDG Monitoring"Assessment of Data Availability" Beirut, 7-10 December 2009 NedaJafar Statistics Division ESCWA
Availability of data • Discrepancy of data • ESCWA strategy • Part I – current activities • Part II – future plans
“Not everything that can be counted counts; and not everything that counts can be counted.” —ALBERT EINSTEIN
Finding - 1 • Major differences exist in the data availability reported by the two sources. • The greater the difference in data availability reported, the higher the possibility of major shortcomings in the reporting mechanism between them • Regional average for national available data: 29 % • Regional average at UNSD database : 16 % • UNSD therefore disseminates little more than half the data reported in national sources
50% 45% 40% 35% 30% 25% 20% 15% 10% 5% 0% United Arab Emirates Jordan Oman Syrian Arab Republic Yemen Egypt Bahrain Lebanon Kuwait Qatar Palestine Saudi Arabia Iraq National data available UNSD data available Data availability: national vs. UNSD
90% 80% 70% 60% 50% 40% 30 % 20% 10% 0% Iraq Yemen Saudi Arabia Syrian Arab Republic United Arab Emirates Qatar Jordan Oman Egypt Kuwait Bahrain Lebanon Palestine Finding - 2 national data not reported in UNSD db(37 % - 78%)
60% 50% 40% 30% 20% 10% 0% Egypt Bahrain Oman Jordan Kuwait Lebanon Qatar Palestine Iraq Yemen Saudi Arabia Syrian Arab Republic United Arab Emirates Finding – 3UNSD available data not found in national db(3%-53%)
9% 8% 7% 6% 5% 4% 3% 2% 1% 0% Yemen Oman Qatar Kuwait Lebanon Jordan Iraq Palestine United Arab Emirates Saudi Arabia Syrian Arab Republic Bahrain Egypt Finding – 4National disaggregated data available and not reported in UNSD database
Finding - 5 • Discrepancy in data value emanates from one or more components related to metadata : • Definition • method of calculation • targeted population and subpopulation • sources of data • estimation methods. • 18 % exact match • 39 % consistent in value (+ or – 10 per cent) • 44 % discrepant
100% 90% 80% 70% 60% 50% 40% 30% 20% 10% 0% Bahrain Lebanon Palestine Kuwait Yemen Egypt Jordan Oman Qatar Iraq Saudi Arabia United Arab Emirates Syrian Arab Republic Exact Consistent Discrepant Available data points for national and UNSD
8th SC PROPOSALS FOR IMPROVEMENT @ national level: • Review current methodologies • Organize workshops • Publish metadata (handbooks and guidelines) • Carry out the required surveys and censuses • Improve administrative registers • Compile disaggregated and gender sensitive indicators • Develop a central repository and making it user-accessible • Publish new MDGR
@ regional level: • Identify regional priorities to improve MDG production & analysis • Propose future courses of action- technical cooperation and statistical capacity-building; • Develop and maintain a regional central database derived from national databases • Monitor availability, track progress and plan capacity-building activities in focused statistical areas; • Discuss mechanisms available to agencies for gathering data from countries, their methods of compilation of international data series and imputations • Identify ways to improve compilation of regional data series by improving reporting mechanisms from national statistical systems to international agencies; • Compile, review and make recommendations to improve national metadata
ESCWA Strategy – Part I Activities: • Compile data series for MDG Indicators • Compile sources of data • Consistency checks • Quality checks • Review data series with NSO • Capacity building workshops • DevInfo workshops: users, administrators and trainers • MDG monitoring workshops • Handbook on MDG Indicators - Arabic • Review national DevInfo databases • Structure • Content • Metadata • Technical advisory services
Common mistakes CO2 emissions per capita • Countries provide data in Kg per capita, while it should be reported in ton per capita. Ex. 0.629 ton per capita CO2 emissions are calculated only • in tons when it is calculated per capita, • in Kg only when calculated per 1$ GDP (PPP) • in metric tons when its calculated alone The Carbon dioxide emissions are calculated by dividing carbon dioxide emissions by the number of people in the national population.
Outputs: • Repositories of national MDG datasets • National DevInfo • Regional DevInfo • National MDG Handbooks (metadata) • ADITT – Arab DevInfo (DI) Training Team
Current Status: Data availability since 2005
ICT indicators • The source of data is important to check whether the methodology is sound, for instance the number ofsubscribers for the below indicators should be obtained from administrative records compiled by national regulatory authorities or telecommunication operators:8.14. Telephone lines per 100 population8.15. Cellular subscribers per 100 populationWhile the below indicator can be based on user surveys.8.16. Internet users per 100 population
The share of women wage employment in non agriculture sector • Countries mistakenly assume that all the women wage employment are 100% and calculate accordingly the proportion of them who work in non-agricultural sectors, the result is a high percentage. It is the share of women from total number of persons in paid employment in the non-agricultural sector
Incidence rates associated with malaria • Incidence rate should be reported and not the number of cases Death rates associated with tuberculosis • Death rate should be reported and not the number of death cases associated with TB Proportion of tuberculosis cases detected under directly observed treatment short course • Indicator 6.10A and 6.10B should be provided as separate indicators • cured under dots • detected under dots
ESCWA Strategy – Part II Activities: • Tailoring MDGs at national and regional levels • Linking to strategies • Customizing MDGs • Localizing MDGS • Capacity building • Workshop(s) on MDG+ • Workshops on analysis and presentations
Outputs: • Extended list of development indicators • (Sub) Regional Handbook on MDG+ Indicators • Repositories of national development indicators • National DevInfo + • Regional DevInfo + • NMDG+ Reports