Download
1 / 59
600 likes | 838 Views
Location. Chapter 11. How Location fits the Operations Management Philosophy . Operations As a Competitive Weapon Operations Strategy Project Management. Process Strategy Process Analysis Process Performance and Quality Constraint Management Process Layout Lean Systems.

E N D
Location Chapter 11
How Location fits the Operations Management Philosophy Operations As a Competitive Weapon Operations Strategy Project Management Process Strategy Process Analysis Process Performance and Quality Constraint Management Process Layout Lean Systems Supply Chain Strategy Location Inventory Management Forecasting Sales and Operations Planning Resource Planning Scheduling
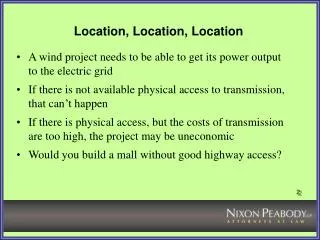
BMW • In the late 1980’s fluctuating exchange rates and rising costs convinced BMW that it was time to consider operating a new production facility outside the European borders. • A “blank page” approach was used to compile a list of 250 potential worldwide sites. Analysis pared the list down to 10 options; a location in the United States was preferred due to its proximity to a large market segment for BMW’s automobiles. • BMW spent 3 1/2 years considered the labor climate, port and road access, geographical requirements and constraints, airport access, and its relations with the governments. • The plant was located in Spartanburg, SC, and now employs approximately 4,700 workers who produce more than 500 vehicles a day.
Location Decisions • Facility location is the process of determining geographic sites for a firm’s operations. • Location decisions affect processes throughout the organization. • Marketing must assess how the location will appeal to customers; possibly opening new markets. • Human Resources must be attuned to the firm’s hiring and training needs. • Accounting and Finance must evaluate costing. • Operations needs to be able to meet current customer demand and provide the right amount of customer contact.
Factors Affecting Location Decisions • Managers must weigh many factors when assessing the desirability of particular locations. • The factor must be sensitive to location. • The factor must have a high impact on the company’s ability to meet its goals.
Dominant Factors in Manufacturing • Favorable labor climate. May be most important factor in labor-intensive industries • Proximity to markets. Important when outbound transportation rates are high. • Quality of life. Good schools, recreational facilities, cultural events and attractive lifestyle. • Proximity to suppliers and resources. Important when inbound transportation costs are high. • Proximity to the parent company’s facilities. Important when coordination and communication is critical. • Utilities, taxes, and real estate costs.
Dominant Factors in Services • Proximity to customers. How conveniently customers can carry on business with a firm. • Transportation costs and proximity to markets. Especially for warehousing and distribution operations. • Location of Competitors. Estimating the sales potential and impact of competition. • Critical mass is a situation whereby several competing firms clustered in one location attract more customers than the total number who would shop at the same stores at scattered locations. • Site-Specific Factors. Including residential density, traffic flow, and site visibility.
Geographical Information Systems and Location Decisions • Geographical information system (GIS) is a system of computer software, hardware, and data that the firm’s personnel can use to manipulate, analyze, and present information relevant to a location decision. It can be used to: • Store databases • Display maps • Create models that can take information from existing datasets, apply analytic functions, and write results into new derived datasets. • Together, these three functionalities of data storage, map displays, and modeling are critical parts of an intelligent GIS, used to a varying extent in all GIS applications.
GPS and Site Selection in the Fast Food Industry • Until recently, fast-food chains used consultants to analyze geodemographic data (demographic data in conjunction with geographic location) for strategic planning, and making franchise location. • Now with the availability of easy-to-use, low cost, GIS systems that can be operated on a regular PC, small and large fast-food chains are doing it on their own. • These programs can estimate the total dollars up for grabs in a market by analyzing local age and income data from the U.S. Census Bureau as well as sales data from stores in an area. • The programs can also tell the optimal number and locations of stores in a market, and how much in sales a store can expect. Analyses can be run for any U.S. market and can rank markets in order of viability.
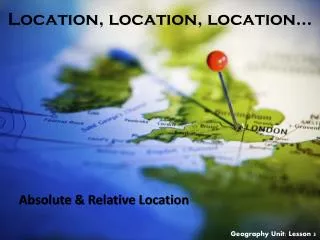
Using GIS to Identify Starbucks Locations • The Starbuck store addresses within 20 miles of Hamilton, Ontario were obtained from the Starbucks Web site, and imported into MapPoint. • These store locations are denoted on maps by yellow dots. Then demographics that come with MapPoint were overlaid on the map. • On the first map, note that Oakville has more store locations than Hamilton even though it has lower population density, suggesting that store location is not being driven by population density alone. • The second map shows the demographics by average per capita household income. Note that in this case, the store locations are based in more affluent areas.
Starbucks locations Population density per square kilometer for each census subdivision.
Onsite Expansion, New Location, or Relocation • Managers must first decide whether to expand onsite, build another facility, or relocate to another site. • Onsite expansion has the advantage of keeping people together, reducing construction time and costs, and avoiding splitting up operations. • However, as a firm expands a facility, at some point diseconomies of scale set in. • A new plant allows it to hire more employees, install newer, more-productive machinery and better technology, and reduce transportation costs. • Most firms that choose to relocate are small (comprised of less than 10 employees). • More than 80 percent of all relocations are made within 20 miles of companies’ original locations, which enables the firms to retain their current employees.
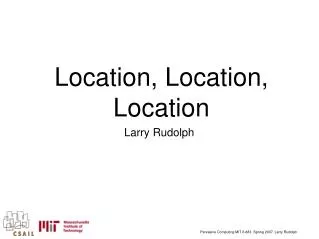
Tyler Emergency Medical Services (EMS) Example 11.1 • The locations of the two existing EMS facilities in Tyler, Texas are shown on the following map. • The population density for each of the city’s tracts is also shown. The darker red areas have up to 5,000 people per square mile. • The southeast part of Tyler, census tract 18.03, has experienced rapid growth, with its population almost doubling in the last twelve years. • The residents of this tract have complained that it takes too long for the EMS vehicles to reach them.
EMS locations Population Density of Tyler, Texas Areas of rapid growth.
Tyler Emergency Medical Services (EMS) Location • A general guideline for locating EMS facilities in urban areas is that an EMS vehicle should be able to answer 95 percent of its calls within 10 minutes in tracts that have a population density of 1,000 people per square mile. • Census tract 7, on the west side of the city with a population density of 967 people per square mile, should be included in the study as well. • Thus, the census tracts that are as dark as or darker than census tract 7, should be within a 10-minute drive time zone of an EMS facility. • Where should EMS locate three facilities so as to meet its coverage goals for Tyler?
10 minute response zones Census Track 7 With MapPoint, it is easy to calculate a drive time zone by just selecting the pushpin and going under “Tools” on the menu bar to select drive time zone in terms of the number of minutes of drive time. Some areas not in coverage zone.
Three EMS locations were chosen through a trial and error approach and evaluation using MapPoint.
Locating a Single Facility • When the facility is part of a firm’s larger network of facilities, we assume that there is no interdependence. • The process of selecting a new facility location involves a series of steps. • Identify the important location factors and categorize them as dominant or secondary. • Consider alternative regions; then narrow the choices to alternative communities and finally to specific sites. • Collect data on the alternatives. • Analyze the data collected, beginning with the quantitative factors. • Bring the qualitative factors into the evaluation. The site with the highest weighted score is best.
Health-Watch Preference MatrixExample 11.2 • A new medical facility, Health-Watch, is to be located in Erie, Pennsylvania. • The following table shows the location factors, weights, and scores (1 = poor, 5 = excellent) for one potential site. Location Factor Weight Score (W)(S) Total patient miles per month 25 4 100 Facility utilization 20 3 60 Average time per emergency trip 20 3 60 Expressway accessibility 15 4 60 Land and construction costs 10 1 10 Employee preference 10 5 50 Weighted Score 340
Application 11.1 WS = WS = WS =
Euclidian Distance dAB= (20–80)2 + (10 – 60)2 = 78.1 Rectilinear Distance dAB= |20–80| + |10 – 60| = 110 Application 11.2Revisiting Distance Measures What is the distance between (20,10) and (80,60)?
Applying the Load-Distance Method • Load–distance method: A mathematical model used to evaluate locations based on proximity factors. • A load may be shipments from suppliers, shipments between plants or to customers, or it may be customers or employees traveling to or from the facility. • The firm seeks to minimize its load–distance (ld) score, generally by choosing a location, so that large loads go short distances. • To calculate ld score for any potential location, we use the actual distance between any two points using a GIS system, and simply multiply the loads flowing to and from the facility by the distances traveled.
Center of Gravity • Center of gravity: A good starting point to evaluate locations in the target area using the load-distance model. • Determine the x and y coordinates of different locations either in the form of the longitude and latitude of the locations, or by creating an (x, y) grid. • The center of gravity’s x-coordinate, denoted x*, is found by multiplying each point’s x-coordinate (either the longitude of the location or the x coordinate on a grid), by its load (li), summing these products (Σlixi), and then dividing by the sum of the loads (Σli). The y-coordinate, denoted y*, is found the same way.
Finding the Center of GravityExample 11.3 • The new Health-Watch facility is targeted to serve seven census tracts in Erie, PA. Customers will travel from the seven census-tract centers to the new facility when they need health care. • What is the target area’s center of gravity for the Health-Watch medical facility? • We will use MapPoint in this solution and coordinates will be represented in the form of latitude & longitude rather than an x, y grid to calculate the center of gravity. • The target area is displayed on the map of Erie using MapPoint. A pushpin is placed in the approximate geographical center of the census tracts. The location sensor is then turned on and used to obtain the coordinates.
© 2007 Pearson Education Finding the Center of Gravity for Health Watch x* is the longitude and y* is the latitude for the center of gravity.
CENSUS MAP OF ERIE, PA Center of Gravity x,y coordinates: 42.1178, -80.4018
Using Break-Even Analysis • Break-even analysis can help a manager compare location alternatives on the basis of quantitative factors that can be expressed in terms of total cost. • Determine the variable costs and fixed costs for each site. • Plot the total cost lines—the sum of variable and fixed costs—for all the sites on a single graph • Identify the approximate ranges for which each location has the lowest cost. • Solve algebraically for the break-even points over the relevant ranges.
Break-Even AnalysisExample 11.4 • An operations manager has narrowed the search for a new facility location to four communities. • The annual fixed costs (land, property taxes, insurance, equipment, and buildings) and the variable costs (labor, materials, transportation, and variable overhead) are shown below. • Total costs are for 20,000 units. Fixed Costs Variable Costs Total Costs Community per Year per Unit (Fixed + Variable) A $150,000 $62 $1,390,000 B $300,000 $38 $1,060,000 C $500,000 $24 $ 980,000 D $600,000 $30 $1,200,000
Fixed Costs Total Costs Community per Year (Fixed + Variable) A $150,000 $1,390,000 B $300,000 $1,060,000 C $500,000 $ 980,000 D $600,000 $1,200,000 1600 A (20, 1390) 1400 (20, 1200) D 1200 B (20, 1060) C 1000 Annual cost (thousands of dollars) (20, 980) 800 Break-even point 600 400 Break-even point 200 A best B best C best 0 2 4 6 8 10 12 14 16 18 20 22 6.25 14.3 Q (thousands of units) © 2007 Pearson Education • Step 1. Plot the total cost curves for all the communities on a single graph. Identify on the graph the approximate range over which each community provides the lowest cost.
Break-Even SolutionExample 11.4 • Step 2. Using break-even analysis, calculate the break-even quantities over the relevant ranges. If the expected demand is 15,000 units per year, what is the best location? (A) (B) $150,000 + $62Q = $300,000 + $38Q Q = 6,250 units (B) (C) $300,000 + $38Q = $500,000 + $24Q Q = 14,286 units
Locating a Facility within a Network of Facilities • The use of GIS tools often simplifies the search for solution when facilities are interacting. • Map the data for existing customers and facilities in the GIS. • Visually split the entire operating area into the number of parts or sub-regions that equal the number of facilities to be located. • Assign a facility location for each region based on the visual density of customer concentration or other factors. Alternately, determine the center of gravity for each part or sub-region determined in step 2 as the starting location point for the facility in that sub-region. • Search for alternate sites around the center of gravity to pick a feasible location that meets the firm's managerial criteria such as proximity to major metropolitan areas or highways. • Compute total load-distance scores and perform capacity checks before finalizing the locations for each region.
Locating Multiples FacilitiesExample 11.5 • Witherspoon Automotive delivers full truckloads of parts to its customers, and returns with a shipment of used automotive parts for disassembly and remanufacturing. • The company presently operates out of two locations in the Southeast--Spartanburg, South Carolina and Orlando, Florida. • Each of these locations has a re-manufacturing facility, along with an attached warehouse that serves as a distribution center (DC). • The Spartanburg facility covers a total of 362 customers in Georgia, North Carolina, South Carolina, and parts of Alabama, Tennessee and Virginia. • The Orlando facility covers a total of 66 customers mostly in Florida, and a small portion of Alabama and Georgia. • The Spartanburg DC and Orlando DC shipped 17,219 and 4,629 full truckload respectively to their customers last year.
Spartanburg service area Orlando service area
Locating Multiple Facilities for Witherspoon Automotive • Witherspoon Automotive has decided to close the Spartanburg facility because of its age and obsolescence, and split the Spartanburg region into two new regions – each with its own manufacturing and distribution center. Five important location factors that would impact their final decision are: • Quality of life: The new facilities should be located in a major metropolitan area. • Distribution costs are a major determinant of profits, and so the total load-distance score should be minimized. • Economies of scale: The size of the two new facilities should not exceed a maximum of 9,500 truckloads of output per year. • The customer truckloads allocated between the two facilities should be fairly balanced given the previous year’s demand data. • Marketing has indicated that they are going to develop the northern Alabama market. Thus the new distribution network should be able to accommodate up to an additional 1,000 full truckload shipments per year from the Alabama market.
Locations & number of full truckload shipments delivered last year in the Spartanburg region
The center of the 2nd region is around Durham, North Carolina. It seems reasonable for the management to locate one of the two new facilities near Atlanta The next step was to partition the customers into two regions, each with a total demand of less than 9,500 truckloads
The Concord site was selected based on highway access & travel. Center of Gravity Four sites were considered based on center of gravity and load-distance measures.
The Transportation Method • The transportation method is a quantitative approach that can help solve multiple-facility location problems. • The transportation method does not solve all facets of the multiple-facility location problem. • It utilizes linear programming to minimize the cost of shipping products from two or more plants, or sources of supply, to two or more warehouses, or destinations.
The Transportation Method • The first step in solving a transportation problem is to format it in a standard matrix, sometimes called a tableau. • The basic steps in setting up an initial tableau are as follows: • Create a row for each plant (existing or new) being considered and a column for each warehouse. • Add a column for plant capacities and a row for warehouse demands and insert their specific numerical values. • Each cell not in the requirements row or capacity column represents a shipping route from a plant to a warehouse. Insert the unit costs in the upper right-hand corner of each of these cells.
The cost to ship one unit from Atlanta to San Antonio. The Transportation MethodExample 11.6 The Sunbelt Pool Company has a plant in Phoenix and three warehouses. It is considering building a new 500-unit plant because business is booming. One possible location is Atlanta. Initial Tableau
Atlanta should ship 400 units to Hot Springs at a cost of $4.60 per unit. The Transportation MethodExample 11.6 Solution This optimal shipping pattern shows that Atlanta should supply all the demand for Hot Springs and a third of the demand at Sioux Falls. Phoenix will supply all the demand at San Antonio and two thirds of the demand at Sioux Falls. Optimal Tableau A dummy column or dummy row is necessary if the supply & demand are not equal.
Phoenix should supply all of San Antonio’s demand and two thirds of demand for Sioux Falls. Atlanta should supply all of the demand for Hot Springs and one third of the demand at Sioux Falls.