Download
1 / 13
140 likes | 244 Views
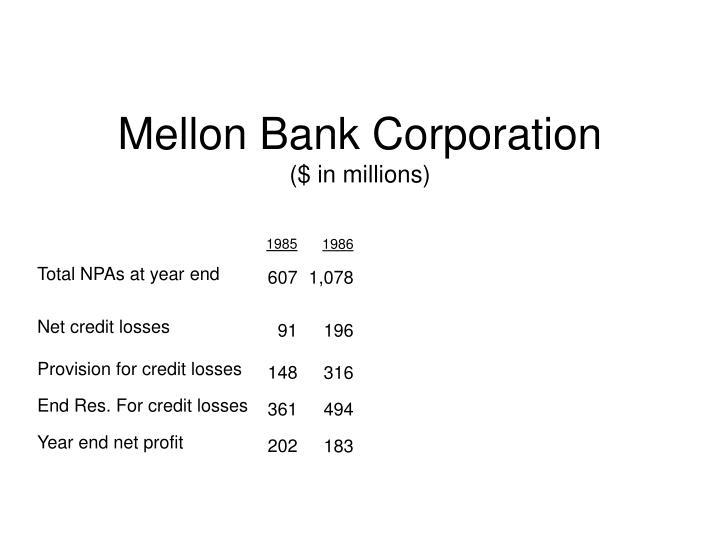
Mellon Bank Corporation ($ in millions). 1985 607 91 148 361 202. 1986 1,078 196 316 494 183. Total NPAs at year end Net credit losses Provision for credit losses End Res. For credit losses Year end net profit. Mellon Bank Corporation ($ in millions). 1985 607 91 148 361

E N D
Mellon Bank Corporation($ in millions) 1985 607 91 148 361 202 1986 1,078 196 316 494 183 Total NPAs at year end Net credit losses Provision for credit losses End Res. For credit losses Year end net profit
Mellon Bank Corporation($ in millions) 1985 607 91 148 361 202 1986 1,078 196 316 494 183 1987 1,649 421 1,056 1,130 (844) Total NPAs at year end Net credit losses Provision for credit losses End Res. For credit losses Year end net profit
GSNBOpening Balance Sheet ($ in millions) Liabilities & Equity A-1 notes $225 A-2 Notes 288 Shareholders Equity: Senior preferred 94 Junior preferred 3 Common 34 $640 Assets Loans $497 Acquired assets 143 $640
Assets Purchased From Mellon($ in millions) GSNB Book Value 7/1/88 $288 209 497 127 15 $639 Book / Gross 44% 64 51 39 29 47% Mellon Gross Amount $649 326 975 326 56 $1,357 Number 47 69* 116 73 2 191 Commercial and industrial loans Real estate loans Total loans Real estate assets Energy properties Total assets * Portfolio of 1,144 residential mortgages considered to be one asset
Real Estate Loans($ in millions) Commercial ($59) 33% Housing units and land ($132) 63% Hotel ($8) 4% Total = $209 million
Real Estate Assets($ in millions) Housing Units ($35) Land ($28) 22% 28% 1% Multi-Family ($2) 47% 2% Hotel ($3) Commercial ($59) Total = $127 million
($ in millions)Forecasted Net Cash Flows A-1 Notes 250 200 150 100 50 A-2 Notes 190 190 Preferred and common 154 151 131 65 22 21 12 8 ’89 ’90 ’91 ’92 ’93 ’94 ’95 ’96 ’97 ‘98 June 30 Fiscal Year
Characteristics of Notes • Note overcollateralization • Asset diversity • Extensive asset reviews • Experienced management team
Overview of Transaction • GSNB – Newly chartered liquidating national bank • Equity purchased by Mellon - $131 million • Mellon will dividend GSNB common to shareholders • Assets purchased from Mellon at fair market value with proceeds from notes and equity
Collection Services Corporation(Subsidiary of Mellon) • Headed by R.H. Daniel - 35 years credit / workout experience - Security Pacific, Crocker, Mellon • 46 key full-time asset managers - More than 250 years of bank credit experience
Mellon Bank Corporation($ in millions) 1985 607 91 148 361 202 1986 1,078 196 316 494 183 1987 1,649 421 1,056 1,130 (844) 1988 964 542 321 909 (65) Total NPAs at year end Net credit losses Provision for credit losses End Res. For credit losses Year end net profit
Mellon Bank Corporation($ in millions) 1985 607 91 148 361 202 1986 1,078 196 316 494 183 1987 1,649 421 1,056 1,130 (844) 1988 964 542 321 909 (65) 1990 781 405 315 525 174 1989 696 598 297 610 210 Total NPAs at year end Net credit losses Provision for credit losses End Res. For credit losses Year end net profit
Mellon Bank Corporation($ in millions) 1985 607 91 148 361 202 1986 1,078 196 316 494 183 1987 1,649 421 1,056 1,130 (844) 1988 964 542 321 909 (65) 1990 781 405 315 525 174 1989 696 598 297 610 210 1992 595 277 185 506 437 1991 933 229 250 596 280 Total NPAs at year end Net credit losses Provision for credit losses End Res. For credit losses Year end net profit