Download
1 / 18
180 likes | 359 Views
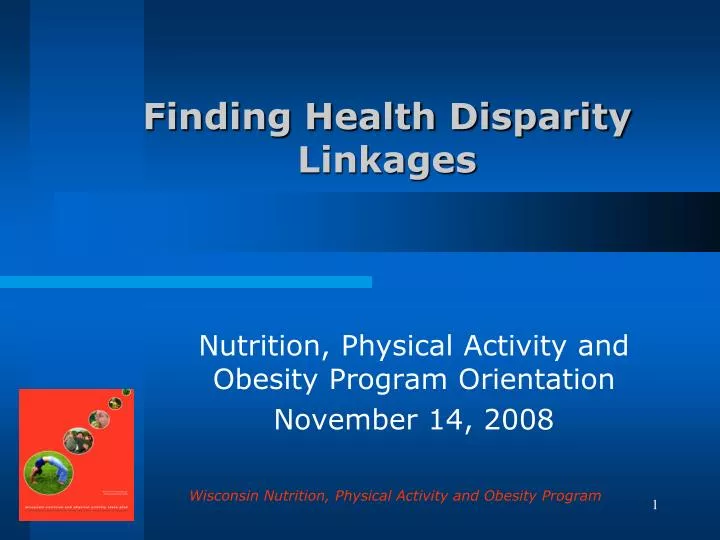
Finding Health Disparity Linkages. Nutrition, Physical Activity and Obesity Program Orientation November 14, 2008. Describe how a health disparities focus affects all aspects of the program. Background on Wisconsin’s efforts to address disparities Challenges Time to Re-focus

E N D
Finding Health Disparity Linkages Nutrition, Physical Activity and Obesity Program Orientation November 14, 2008 Wisconsin Nutrition, Physical Activity and Obesity Program
Describe how a health disparities focus affects all aspects of the program • Background on Wisconsin’s efforts to address disparities • Challenges • Time to Re-focus • Questions/Discussion Wisconsin Nutrition, Physical Activity and Obesity Program
State Plan: Seven Goals • Infrastructure & Technical Support • Consistent Messages & Materials • Environmental Change • Policy Change • Focus on Proven Strategies • Data and Evaluation System • Address Disparities Wisconsin Nutrition, Physical Activity and Obesity Program
Overarching Wisconsin Nutrition, Physical Activity and Obesity Program
Challenges… • No one committee had lead responsibility • WI PAN lacked diverse representation • “Competition” among chronic disease programs/partner groups • Minority Health Program • How to distribute limited resources • Pockets of activity Wisconsin Nutrition, Physical Activity and Obesity Program
Intentional Purposeful Deliberate Wisconsin Nutrition, Physical Activity and Obesity Program
The Health of Wisconsin Report Card • Healthiest State Project • Phase I: Assess Wisconsin's population health in a way that can be periodically compared with the population health of other US states. • Phase II: Develop an evidence-based plan so that we can efficiently achieve and maintain the goal of being the healthiest state with less disparity. This phase will involve systematic reviews of relevant literature and solicitation of expert input. • Phase III: Disseminate findings. Wisconsin Nutrition, Physical Activity and Obesity Program
Results Wisconsin Nutrition, Physical Activity and Obesity Program
What if we could reduce health disparities in Wisconsin? Angela Rohan, PhD CDC/CSTE Applied Epidemiology Fellow Wisconsin Nutrition, Physical Activity and Obesity Program
A B C D F Wisconsin Working-Age Adult Mortality Rates (Ages 25-64, rates per 100,000 population) Whites (279) Rural (319) Non-urban (275) Men (367) Suburban (247) *Note: Mortality data for Hispanics were not reliable enough to present in comparison to the other rates Women (225) Milwaukee County (424) Some college (212) High school or less (459) College graduates (188) Native Americans (592) Asians (170) African Americans (624) Best state Minnesota (257) Wisconsin (296) Worst state Mississippi (519)
A B C D F Wisconsin Working-Age Adult Mortality Rates (Ages 25-64, rates per 100,000 population) Whites (279) Rural (319) Non-urban (275) Men (367) Suburban (247) *Note: Mortality data for Hispanics were not reliable enough to present in comparison to the other rates Women (225) Milwaukee County (424) Some college (212) High school or less (459) College graduates (188) Native Americans (592) (279) Asians (170) African Americans (624) (279) Best state Minnesota (257) Wisconsin (296) Worst state Mississippi (519) (277)
A B C D F Wisconsin Working-Age Adult Mortality Rates (Ages 25-64, rates per 100,000 population) Whites (279) Rural (319) Non-urban (275) (275) Men (367) Suburban (247) *Note: Mortality data for Hispanics were not reliable enough to present in comparison to the other rates Women (225) Milwaukee County (424) (275) Some college (212) High school or less (459) College graduates (188) Native Americans (592) Asians (170) African Americans (624) Best state Minnesota (257) Wisconsin (296) Worst state Mississippi (519) (266)
A B C D F Wisconsin Working-Age Adult Mortality Rates (Ages 25-64, rates per 100,000 population) Whites (279) Rural (319) Non-urban (275) Men (367) Suburban (247) (225) *Note: Mortality data for Hispanics were not reliable enough to present in comparison to the other rates Women (225) Milwaukee County (424) Some college (212) High school or less (459) College graduates (188) Native Americans (592) Asians (170) African Americans (624) Best state Minnesota (257) Wisconsin (296) Worst state Mississippi (519) (225)
A B C D F Wisconsin Working-Age Adult Mortality Rates (Ages 25-64, rates per 100,000 population) Whites (279) Rural (319) Non-urban (275) Men (367) Suburban (247) *Note: Mortality data for Hispanics were not reliable enough to present in comparison to the other rates Women (225) Milwaukee County (424) Some college (212) High school or less (459) (212) College graduates (188) Native Americans (592) Asians (170) African Americans (624) Best state Minnesota (257) Wisconsin (296) Worst state Mississippi (519) (206)
Time to Re-Focus…Aligning the Stars • Minority Health Leadership Council • Program Integration – focus on disparities • Tobacco’s “Bringing Everyone Along” disparity reduction strategic plan • NPAO Work Plan Goal • Comprehensive Center of Excellence for Eliminating Health Disparities • New Minority Health Officer • What Works: Reducing Health Disparities in Wisconsin Communities • Health of Wisconsin Report Card Wisconsin Nutrition, Physical Activity and Obesity Program
Next Steps… Develop and implement a disparity plan • Convened an internal planning group • Reviewing data & other plans • Inventorying current activities • Incorporating a disparity focus in funding opportunities • Targeting interventions to disparate populations Wisconsin Nutrition, Physical Activity and Obesity Program
For more information... • Mary Pesik, Program Coordinator • Mary.pesik@wisconsin.gov or 608-267-3694 • Amy Meinen, Nutrition Coordinator • Amy.meinen@wisconsin.gov or 608-267-9194 • Jon Morgan, Physical Activity Coordinator • Jonathon.morgan@wisconsin.gov or 608-266-9781 • Janice Liebhart, Epidemiologist • Janice.lievhart@wisconsin.gov or 608-266-8496 Wisconsin Nutrition, Physical Activity and Obesity Program
Questions? Wisconsin Nutrition, Physical Activity and Obesity Program