Download
1 / 19
190 likes | 343 Views
Impact of Reference Distance for Motion Compensation Prediction on Video Quality. Yubing Wang , Mark Claypool and Robert Kinicki WPI Computer Science Department Worcester, MA 01609 Wang_yubing@emc.com. ACM/SPIE Multimedia Computing and Networking (MMCN)

E N D
Impact of Reference Distance for Motion Compensation Prediction onVideo Quality Yubing Wang, Mark Claypool and Robert Kinicki WPIComputer Science Department Worcester, MA 01609 Wang_yubing@emc.com ACM/SPIE Multimedia Computing and Networking (MMCN) San Jose, California, January 31, 2007
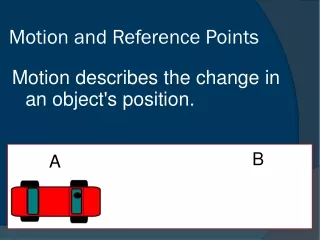
Introduction • Packet loss degrades video quality. • Reference Picture Selection (RPS) selects one of several previous frames as a reference frame. • Distance from selected frame is reference distance • Higher reference distance, lower quality and vice versa • Two modes: NACK and ACK • A systematic study of the effects of reference distance on video quality. • A set of videos are selected • Motion and scene complexity • H.264 encoded (supports RPS) • Two objective measures: • PSNR • VQM
Outline • Introduction • Background • Hypothesis • Methodology • Results and Analysis • Conclusions
Reference Picture Selection (ACK) • The decoder acknowledges all correctly received frames. • Only the acknowledged frames are used as a reference. • Error propagation is avoided entirely. • Reference distance increases with round-trip delay. • Coding efficiency decreases as reference distance increases. • Video quality degrades due to limited bit-rate. 6 7 1 3 4 5 2 ACK(1) ACK(2) ACK(3)
Reference Picture Selection (NACK) • The previous frame is used as a reference during the error-free transmission. • Reference distance is always 1 regardless of RTT • The decoder sends a NACK for the erroneous frame along with a reference frame • Error propagation • Impact of loss increases with RTT 5 6 7 8 1 3 4 2 NACK(3)
RPS ACK or RPS NACK? • Which to use? • Depends upon loss and loss pattern • Depends upon round-trip delay • Depends upon the effects of reference distance • Can quantify effects of loss and delay • Need to quantify the effects of reference distance on video Quality • Will help determine choice between NACK and ACK
Video Quality Measurement • Video Quality Metrics: • SSIM (Z. Wang et al), MPQM (C. Branden et al), … • PSNR • VQM (ITS) • Video Quality Metric (VQM) • Developed by the Institute for Telecommunication Science (ITS). • Provides an objective measurement for perceived video quality based on user studies. • Measures the perceptual effects of video impairments and combines them into a single metric. • VQM models include: Television, Videoconferencing, General, Developer, PSNR.
Outline • Introduction • Background • Hypothesis • Methodology • Results and Analysis • Conclusions
Hypothesis • Low Motion: • The similarities among frames are high; • More macro-blocks are inter-coded; • High motion: • The similarities among frames are low; • More macro-blocks are intra-coded; • The y-intersect is determined by motion and scene complexity. • High-motion video sequences starts with low quality, degrade slower. • Low-motion video sequence starts with high quality, degrade faster.
Outline • Introduction • Background • Hypothesis • Methodology • Results and Analysis • Conclusions
Methodology • Select a set of non-compressed video clips with a variety of motion content. • All in YUV 4:2:0, CIF (352x288) • Each video sequence contains 300 video frames with a frame rate of 30 fps. • Change reference distances for each selected video sequence. • Encode the video clips using H.264. • Only P-slices or I-slices are used. • Same bit-rate constraint is imposed for all experiments. • Only one single reference frame is used • Measure video quality using PSNR and VQM. • Analyze the results.
Outline • Introduction • Background • Hypothesis • Methodology • Results and Analysis • Conclusions
PSNR vs. Reference Distance (1) • The video quality for videos with high motions tends to degrade slower than that for those videos with low motion.
PSNR vs. Reference Distance (2) The relationship between PSNR and reference distance can be characterized using a logarithmic function:
VQM vs. Reference Distance (1) • We use (1-VQM) as the quality metric. • The same trend as the ones with PSNR.
VQM vs. Reference Distance (2) The relationship between VQM and reference distance can be characterized using a linear function:
Conclusion • Both PSNR and VQM video quality degrade as reference distance increases. • The degree of the video quality degradation is affected by the video content. • High-motion video sequences starts with lower quality, degrade slower. • Low-motion video sequences starts with higher quality, degrade more rapidly. • Mathematical Characterization of the relationship between video quality and reference distance: • PSNR: • VQM:
Future Work • Include a broader set of video clips. • Develop an analytical model to compare RPS NACK and ACK mode: • Use reference distance results! • Packet loss rate • Round-trip delay • Bit-rate constraints • Insight to other repair techniques.