Download
1 / 19
190 likes | 273 Views
Work and play: Disease spread, social behaviour and data collection in schools. Dr Jenny Gage, Dr Andrew Conlan, Dr Ken Eames. Interpreting the network. Roberto. Ken. Johann. Julia. Andrew. Tom. Josh. Alicia. How is the network different from a random network?

E N D
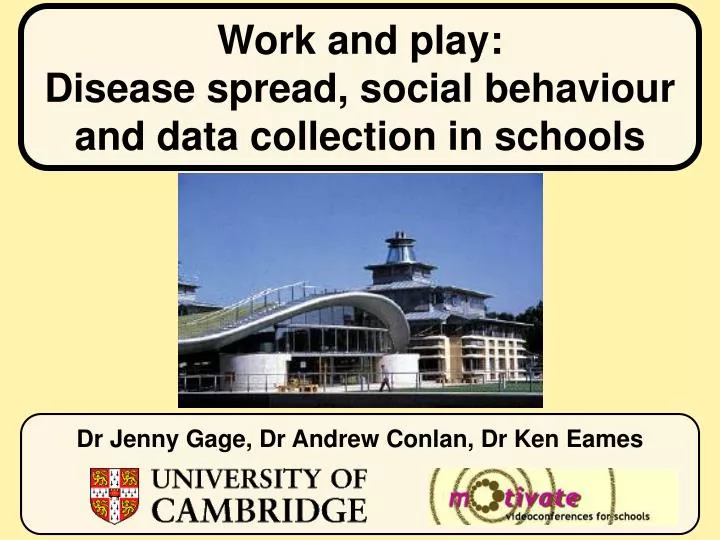
Work and play: Disease spread, social behaviour and data collection in schools Dr Jenny Gage, Dr Andrew Conlan, Dr Ken Eames
Interpreting the network Roberto Ken Johann Julia Andrew Tom Josh Alicia • How is the network different from a random network? • What features of the network are unexpected?
Classifying links The out-degree is the number of people the student named: A1 has out-degree 3 A1 The in-degree is the number of people who named the student: A1 has in-degree 2 A1
A1 A4 Mutual links Two students who both name each other form a mutual link
Mutual links Roberto Ken Andrew Johann Julia Tom Josh Alicia
Activity Using the data table on the previous slide 1. Find the Out-degrees A1 2. Find the In-degrees A1 3. In the table, circle Mutual Links A1 4. Find the Mutual Degree How variable is the dataset? Are these patterns random?
Degree distribution We can plot the degree distribution as a bar chart In-degree Mutual degree Some variation is natural; can use statistical tools to tell us how unexpected the observed distributions are.
Mutual links If people choose their contacts at random, how many mutual links would we see? • 8 people fill in the survey; each names 2 contacts. • The probability that Alicia’s first contact (Julia) also names Alicia equals 2/7. Why? • Total number of mutual links expected is therefore 8 x 2 x 2/7 ≈ 4.6
Mutual links If people choose their contacts at random, how many mutual links would we see? Actually this is double the number of links, since each link has two ends. It’s the number of entries ringed in red in the data table. • 8 people fill in the survey; each names 2 contacts. • The probability that Alicia’s first contact (Julia) also names Alicia equals 2/7. Why? • Total number of mutual links expected is therefore 8 x 2 x 2/7 ≈ 4.6
Mutual links • N people fill in the survey; each name k contacts. • The probability that person A’s first contact names person A equals k / (N - 1). • Total number of mutual links expected is therefore:
Mutual links With 8 people, we expect 4.6 mutual contacts:
Mutual links We expect 4.6 mutual contacts, but in fact find 10. Many more mutual links than a random network. This is what we would expect if connections represent interactions such as friendships.
Split into groups of 8-12. Each choose two other members of the group. Write everyone’s choices in a data table. Make the network: write each person’s name on a piece of paper place person with the most connections in the centre starting with the second most “popular” arrange the other names around the centre work through the table and make connections move people around to make the network clearer draw final network onto paper Activity
Tabulate the in-degree and out-degree for each person. Find the actual number of mutual links. Calculate the predicted number of mutual links, using the formula: Do you think the choices you made were random or not? Activity k = no. choices N = no. people in group
Example of network data Primary school network, pupils aged 10-11.
It is likely that: • green and red distinguish between boys and girls • someone was absent