Download
1 / 1
10 likes | 154 Views
DMSP SSM/I/S and Future Microwave Imager Climate Data Records. Fuzhong Weng 1(GOVERNMENT PRINCIPAL INVESTIGATOR) , Ninghai Sun 1,2 , Banghua Yan 1,3 1 NOAA/NESDIS/STAR/SMCD, 2 IMSG, 3 ESSIC.

E N D
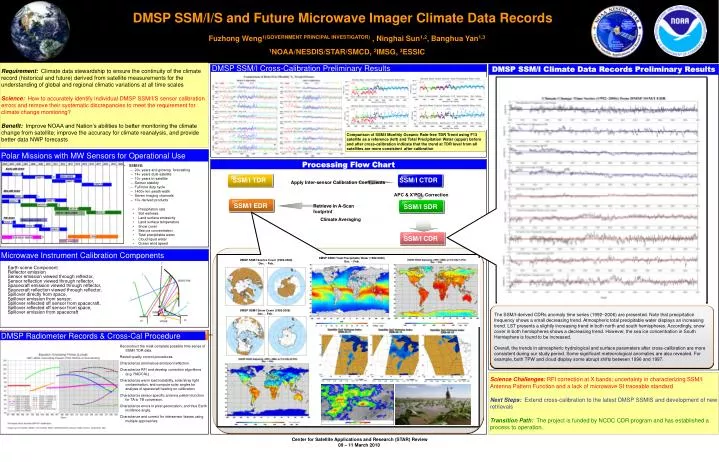
DMSP SSM/I/S and Future Microwave Imager Climate Data Records Fuzhong Weng1(GOVERNMENT PRINCIPAL INVESTIGATOR) , Ninghai Sun1,2, Banghua Yan1,3 1NOAA/NESDIS/STAR/SMCD, 2IMSG, 3ESSIC Requirement: Climate data stewardship to ensure the continuity of the climate record (historical and future) derived from satellite measurements for the understanding of global and regional climatic variations at all time scales Science:How to accurately identify individual DMSP SSM/I/S sensor calibration errors and remove their systematic discrepancies to meet the requirement for climate change monitoring? Benefit: Improve NOAA and Nation’s abilities to better monitoring the climate change from satellite; improve the accuracy for climate reanalysis, and provide better data NWP forecasts DMSP SSM/I Climate Data Records Preliminary Results DMSP SSM/I Cross-Calibration Preliminary Results Comparison of SSM/I Monthly Oceanic Rain-free TDR Trend using F13 satellite as a reference (left) and Total Precipitation Water (upper) before and after cross-calibration indicate that the trend at TDR level from all satellites are more consistent after calibration Polar Missions with MW Sensors for Operational Use Processing Flow Chart • SSM/I/S: • 20+ years and growing forecasting • 14+ years dual-satellite • 10+ years tri-satellite • Sensor stability • Full time duty cycle • 1400+ km swath width • Seven imaging channels • 10+ derived products SSM/I TDR SSM/I CTDR Apply Inter-sensor Calibration Coefficients APC & X’POL Correction SSM/I EDR SSM/I SDR Retrieve in A-Scan footprint • Precipitation rate • Soil wetness • Land surface emissivity • Land surface temperature • Snow cover • Sea ice concentration • Total precipitable water • Cloud liquid water • Ocean wind speed Climate Averaging SSM/I CDR Microwave Instrument Calibration Components DMSP SSM/I Total Precipitable Water (1992-2006) Dec. ~ Feb. DMSP SSM/I Sea Ice Cover (1992-2006) Dec. ~ Feb. Earth scene Component Reflector emission Sensor emission viewed through reflector, Sensor reflection viewed through reflector, Spacecraft emission viewed through reflector, Spacecraft reflection viewed through reflector, Spillover directly from space, Spillover emission from sensor, Spillover reflected off sensor from spacecraft, Spillover reflected off sensor from space, Spillover emission from spacecraft DMSP SSM/I Snow Cover (1992-2006) Dec. ~ Feb. The SSM/I-derived CDRs anomaly time series (1992~2006) are presented. Note that precipitation frequency shows a small decreasing trend. Atmospheric total precipitable water displays an increasing trend. LST presents a slightly increasing trend in both north and south hemispheres. Accordingly, snow cover in both hemispheres shows a decreasing trend. However, the sea ice concentration in South Hemisphere is found to be increased. Overall, the trends in atmospheric hydrological and surface parameters after cross-calibration are more consistent during our study period. Some significant meteorological anomalies are also revealed. For example, both TPW and cloud display some abrupt shifts between 1996 and 1997. DMSP Radiometer Records DMSP Radiometer Records & Cross-Cal Procedure Reconstruct the most complete possible time series of SSM/I TDR data. Revisit quality control procedures. Characterize anomalous emission/reflection. Characterize RFI and develop correction algorithms (e.g. RADCAL) Characterize warm load instability, solar/stray light contamination, and compute solar angles for analysis of spacecraft heating on calibration. Characterize sensor specific antenna pattern function for TA to TB conversion. Characterize errors in pixel geolocation, and thus Earth incidence angle. Characterize and correct for intersensor biases using multiple approaches. Science Challenges: RFI correction at X bands; uncertainty in characterizing SSM/I Antenna Pattern Function and a lack of microwave SI traceable standard Next Steps:Extend cross-calibration to the latest DMSP SSMIS and development of new retrievals Transition Path: The project is funded by NCDC CDR program and has established a process to operation.