Download
1 / 155
1.55k likes | 1.7k Views
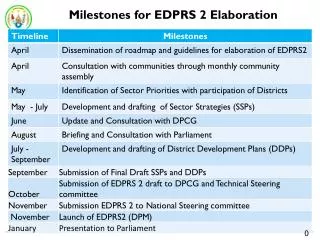
AGRICULTURE INVENTORY ELABORATION PART 2. Status of national communications from NAI Parties. By September 2003, 70 national communications (NCs) from non-annex I (NAI) Parties had been compiled and assessed by the UNFCCC secretariat

E N D
Status of national communications from NAI Parties • By September 2003, 70 national communications (NCs) from non-annex I (NAI) Parties had been compiled and assessed by the UNFCCC secretariat • According to Compilation and Synthesis reports, the problems encountered by NAI Parties in elaborating their national inventories ranked: • activity data 93 per cent • emission factors 64 per cent • methods 11 per cent
Status of national communications from NAI Parties • NAI countries voluntarily submit their national GHG inventories and NCs • By mid-2005, 117 NAI Parties had submitted their first national communication; 3 NAI Parties had submitted their second NC; 1 NAI Party did not include its national inventory • Submitted inventories: 82 NAI Parties for 1 year (1994, mainly); 12 NAI Parties for 2 years (1990/94); 18 NAI Parties for 3–4 years; 12 NAI Parties for >4 years • 100% NAI Parties included CO2; 99% included CH4 and N2O; 20% included HFCs, PFCs or SF6
Status of national communications from NAI Parties • An important proportion of the problems mentioned are related to LUCF • Eliminating this sector from the analysis, the number of Parties mentioning problems decreases substantially: • Problems only with LUCF: 13 per cent (9 countries) • Problems with LUCF and other sectors: 60 per cent (42 countries) • Problems, excluding mention to LUCF: 27 per cent (19 countries)
Status of national communications from NAI Parties • The Agriculture sector is second in terms of problems: • Problems only with Agriculture: 0 per cent • Problems with Agriculture and other sectors: 54 per cent (38 countries) • Problems excluding Agriculture: 46 per cent (32 countries) • Figures indicate that the Agriculture sector is less problematic – with regard to elaboration of an accurate GHG inventory – than is the LUCF sector • 32 out of 70 NAI countries reported that Agriculture is not a problem (19 NAI countries reported that the LUCF sector is not a problem)
INVENTORY ELABORATION • Previous activities undertaken in the framework of national GHG inventories: • Preliminary key-source determination • Mass balance for crop residues and animal manure • Significance of sub-source categories (animal species, anthropogenic N sources) • Livestock characterization, as part of specific source category elaboration
INVENTORY ELABORATIONPrevious activities • Preliminary key-source determination • Two ways: • Using last year’s GHG inventory data • Applying tier 1 methods for all the sectors for the year to be inventoried
DETERMINATION OF KEY SOURCES Steps • Enumeration of source categories (SC) • Ranking SC according to their emissions of CO2 equivalent • Estimating individual contributions of the SC to the total national emissions by dividing the specific contribution by total emissions and expresing the result in per cent • Calculating the accumulative contribution of the SC • Key sources, added together, should account for 95% of GHG emissions
DETERMINATION OF KEY SOURCES 1994 GHG inventory of Chile (Gg CO2 equivalent) (Non-energy sectors)
INVENTORY ELABORATIONMass balance • Mass balance for crop residues: • To be done for each crop species • Example: wheat production in a country with three agroecological units • Characteristics of the agroecological units: • A: Dessert climate, agriculture only under irrigation • B: Mediterranean climate with well-marked four seasons; export agriculture under irrigation • C: Rainy and rather cold climate with no dry season; no irrigation
INVENTORY ELABORATIONMass balance • According to experts’ judgement:
INVENTORY ELABORATIONMass balance • Factors to be applied to total wheat residues: • Total wheat residues = total productionunit i × (residue/production) factorunit i • Total residues burned in: Unit A = total residuesunit A × 0.50 Unit B = total residuesunit B × 0.35 Unit C = total residuesunit C × 0.20
INVENTORY ELABORATIONMass balance • Mass balance for animal manure • Analysis at species level • First diversion, confinement and direct grazing • Second diversion, under confinement, according to the different manure treatment systems
INVENTORY ELABORATION Mass balance • Example: non-dairy cattle population in the same country (same three agroecological units already described) • First: disaggregation of the national population in agroecological unit populations • Second: estimation of total manure produced per agroecological unit 3B.17
INVENTORY ELABORATION Mass balance • Manure from non-dairy cattle, assigned to the different treatment systems: • Unit A: total manure producedunit A x Fi • If Fi is 0.90 = Anaerobic lagoon • If Fi is 0.10 = direct grazing • (Fi= 0 for the rest of the treatment systems) • Unit B: total manure producedunit A x Fj • If Fj is 0.75 = Direct grazing • If Fj is 0.10 = Anaerobic lagoon • If Fj is 0.20 = Solid systems • If Fj is 0.05 = Other systems • (Fj= 0 for the rest of the treatment systems) • Unit C: total manure producedunit A x Fk • If Fk is 0.35 = Direct grazing • If Fk is 0.35 = Anaerobic lagoon • If Fk is 0.20 = Solid systems • If Fk is 0.10 = Other systems • (Fk= 0 for the rest of the treatment systems)
INVENTORY ELABORATIONSignificance of sub-sources • Significance of animal species: • Example for CH4 linked to enteric fermentation and manure management • CH4 emissions estimated by tier 1 method • Country as a whole, without division into agroecological units
INVENTORY ELABORATIONSignificance of sub-sources • Steps: • Estimation of animal species population • As no national AD are available, the use of FAO database is appropriate • Disaggregation between dairy and non-dairy cattle, following experts’ judgement • Filling of Table 4-1s1 of IPCC software with the population data and the default EFs • Estimation of individual contribution to the total emissions of the source category
Significance of sub-sources 22% 13% 43% SIGN. 65% SIGN. <1% 6% <3% <1% <3% <1% <1% <3% <3% <1% <3% 43% SIGN. <1% 3B.21
INVENTORY ELABORATION • Simulation for: • Enteric fermentation – CH4 emissions • Manure management – CH4 and N2O emissions • Agricultural soils – N2O emissions • Prescribed burning of savannas – non-CO2 gas emissions • Burning of crop residues – non-CO2 gas emissions • Rice cultivation – CH4 emissions • When possible, analysis of different scenarios: • Less accurate scenario: No CS activity data (usual for non-collectable data: factors, parameters) • Medium accurate scenario: No CS emission factors (very common fact) • Most accurate scenario: Availability of CS activity data and emission factors
Enteric fermentation • Hypothetical country with: • Two climate regions: • Warm (60% of surface) • Temperate (40% of surface) • Domestic animal population: • Cattle (dairy and non-dairy) • Sheep • Swine • Poultry • Some goats and horses
Livestock characterization • Steps: • Identify and quantify existing livestock species • Review emission estimation methods for each species • Identify the most detailed characterization required for each species (i.e. ‘basic’ or ‘enhanced’) • Use same characterization for all sources (‘Enteric Fermentation’, ‘Manure Management’, ‘Agricultural Soils’) characterization detail will depend on whether the source category is key source or not and on the relative importance of the subcategory within the source category
Enteric fermentation • Inventory simulation for three scenarios: • 1) Low level of data availability • no access to reliable statistics or other sources of AD, and cannot use Country Specific (CS) EFs • 2) Medium level of data availability • detailed statistics on livestock activity, although some Activity Data (AD2) are still required along with default/regional EFs • 3) High level of data availability • good country-specific AD and EFs
Species/category Number of animals (million) Dairy cattle* 1.0 Non-dairy cattle 5.0 Buffalo 0 Sheep 3.0 Goat 0.05 Camels 0 Horses 0.01 Mules and asses 0 Swine 1.5 Poultry 4.0 Low level of data availability Animal population data from FAO database <www.fao.org>. Open the web page; select “Statistical Databases”, “FAOSTAT-Agriculture” and “Live Animals” in Agricultural Production (searching for country, animal type and year): * Disaggregation between dairy and non-dairy cattle based on expert’s judgement. 3B.27
Determination of significantsub-source categories • Species contributing to 25% or more of emissions should have ‘enhanced’ characterization and tier 2 method should be applied • Perform a rough estimation of CH4 from enteric fermentation applying tier 1 method • one way of screening species for their contribution to emissions • estimation is to identify categories requiring application of tier 2 method • use IPCC software, sheet ‘4-1s1’: fill in animal population data, and collect default EF from Tables 4-3 and 4-4 of Revised 1996 IPCC Guidelines, Vol. 3 (also taken from the IPCC emission factor database (EFDB))
Determining significant animal species Worksheet 4-1s1 >25% No other significant species Conclusion: Tier 2 method, supported by an enhanced characterization, for the non-dairy cattle. 3B.29
Enhanced characterization ofnon-dairy cattle population • Enhanced characterization requires information additional to that provided by FAO statistics. Consultation withlocal experts or industryis valuable. • Assume that (using the above information sources) the inventory team determines that the non-dairy cattle population is composed of: • Cows – 40% • Steers – 40% • Young growing animals – 20% • Each of these categoriesmust have an estimate offeed intakeand anEFto convert intake to CH4 emissions. Procedure is described in IPCC Good Practice Guidance and Uncertainty Management in National Greenhouse Gas Inventories (GPG2000)(pages 4.10–4.20).
Enhanced characterization of non-dairy cattle (2) To check the estimates of GE, convert to kg/day of feed intake (by dividing GE by 18.45) and divide by live weight. The result must be between 1% and 3 % of live weight. 3B.32
Tier 2 estimation of CH4 emissions fromenteric fermentation by non-dairy cattle • Enhanced characterization yielded AD (average daily gross energy intake) for three types of non-dairy cattle • These AD must be combined with emission factors for each animal group to obtain emission estimates • Determination of EFs requires selection of a suitable value for methane conversion rate (Ym) • In this example (country with no CS data) a default value for Ym can be obtained from GPG2000
Tier 2 estimation of CH4 emissions from enteric fermentation by non-dairy cattle 3B.34
Tier 2 estimation of CH4 emissions from enteric fermentation by non-dairy cattle • Tier 2 estimation for non-dairy cattle: • 259 Gg CH4(against 245 Gg CH4 for tier 1) • Weighted EF: • 52 kg CH4/head/yr(againts the default value of 49 kg CH4/head/yr) • This value should be used in the worksheet to report emissions by non-dairy cattle
Medium level of data availability • Assume that the country has good statistics on livestock populations • Applying the same procedure as in previous example, the country determines that non-dairy cattle category requires enhanced characterization • National statistics + expert judgement allow disaggregation of non-dairy cattle population by: • Two climate regions • Three systems of production • Three animal categories (same as in previous example)
Medium Level of Data Availability New total: 5,153,000 heads (against FAO: 5,000,000 heads). 3B.37
Tier 2 estimation of CH4 emissions from enteric fermentation by non-dairy cattle • Enhanced characterization yielded AD (average daily gross energy intake) for 18 classes of non-dairy cattle • This AD must be combined with EFs for each animal class to obtain 18 emission estimates • Next slides will show detailed calculations for estimating gross energy intake for 6 of the 18 classes (three types of animals for ‘Warm-Extensive Grazing’ and three for ‘Temperate-Intensive Grazing’)
Enhanced characterization, non-dairy cattleWarm Climate,Extensive Grazing(1) Comments in green indicate improvements over previous example. 3B.39
Enhanced characterization, non-dairy cattleWarm Climate,Extensive Grazing(2) To check estimates of GE, convert to kg/day of feed intake (by dividing GE by 18.45) and divide by live weight. The result must be between 1 and 3 % of live weight. 3B.40
Enhanced characterization, Non-Dairy Cattle,Temperate Climate,Intensive Grazing(1) Comments in green indicate improvements over previous example. 3B.41
Enhanced characterization, Non-Dairy Cattle,Temperate Climate,Intensive Grazing(2) To check estimates of GE, convert to kg/day of feed intake (by dividing GE by 18.45) and divide by live weight. The result must be between 1 and 3 % of live weight. 3B.42
Medium level of data availability • Estimated GE values are used for calculation of EF (using equation 4.14, GPG2000) • Calculation of EF required to select a value for methane conversion rate (Ym), that is, the fraction of energy in feed intake that is converted to energy in methane • In this example we assume the country uses a default value (Ym =0.06, from Table 4.8, GPG2000) • 18 estimates of EF were obtained (next slide)
Medium level of data availability • Weighted EF (tier 2, country-specific AD):57 kg CH4/head/yr (range: 42-67 kg CH4/head/yr) • EF for tier 1:49 kg CH4/head/yr • EF for tier 2 (with default AD):52 kg CH4/head/yr • Multiplication of EF with cattle population in each class yielded 18 estimates of annual emissions of methane from enteric fermentation, with a total of294 Gg CH4/year • Total for tier 1:245 Gg CH4/year • Total for tier 2 (with default AD):259 Gg CH4/year
Medium level of data availability Worksheet 4-1s1 3B.46
Highest level of data availability • Activity data could be improved by: • more accurate national statistics on livestock population and uncertainties • further disaggregation of cattle population (e.g. by race and animal age, or by subdividing climate region by administrative units, soil type, forage quality, etc.) • implementation of geographically explicit AD and cattle traceability systems • development of local research to obtain better estimates of parameters used for livestock characterization(e.g. coefficients for maintenance, growth, activity or pregnancy)
Highest level of data availability • EFs could be improved by: • developing local capacities for measuring CH4 emissions by cattle • characterizing diverse feeds by their CH4 conversion factors for different animal types • development of local research to improve understanding of locally relevant factors affecting methane emissions • adapting international information (scientific literature, EFDB, etc.) from areas with conditions similar to those of the country
Highest level of data availability • Numerical example not developed here • Few, if any, developing countries are currently in the position of having access to this level of information • With high level of data availability, countries would be able to implement tier 3 methods (still not proposed by IPCC)
Example of development of local capacity in Uruguay • Almost 50% of GHG emissions in Uruguay come from enteric fermentation • A project was implemented by the National Institute of Agricultural Research co-funded by US-EPA to improve local capacity to measure CH4 • First results indicate that IPCC default EF used so far in preparation of inventories may be too high • A similar project is being conducted in Brazil by EMBRAPA 3B.50