Download
1 / 54
540 likes | 663 Views
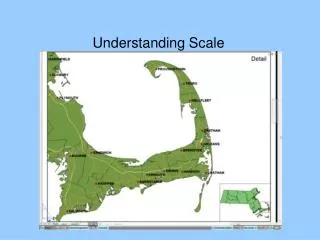
SCALE & ACCURACY. SCALE. The amount of reduction that takes place in going from real-world dimensions to the new mapped area on the map plane. Defined as the ratio of map distance to earth distance, with each distance expressed in the same units of measurement. Verbal Scales.

E N D
SCALE • The amount of reduction that takes place in going from real-world dimensions to the new mapped area on the map plane. • Defined as the ratio of map distance to earth distance, with each distance expressed in the same units of measurement.
Verbal Scales One foot equals 24000 feet One inch equals one mile • Useful for a quick sense of ground units in familiar units. • Unreliable, subject to misinterpretation, invalidated by reduction and enlargement.
Bar Scales • Most effective • Map user can better measure and interpret distances within the map area. • Expands or shrinks along with other map distances, so it remains valid over all reductions and enlargements.
Large Scale vs. Small Scale 1 Large Scale e.g. 1:1000 1000 1 Small Scale e.g. 1:250000 250000 • The terms “large scale” and “small scale” refer to scale shown as a fraction. • 1:1000 is a relatively small denominator, yet it is a much bigger fraction (and thus a larger scale) than 1:250000 • Large scale map features are relatively large. Small scale map features are relatively small.
Large Scale e.g. 1:24000 - quad scale e.g. 1:12000 - quarter quad scale e.g. 1:2400 - tidelands maps • Shows a relatively small portion of the earth’s surface • Provides detailed information • Usually maps that are 1:24000 or larger are considered large scale
Small Scale e.g. 1:250,000 - Hudson county e.g. 1:3,300,000 - State of New Jersey • Shows relatively large areas of the earth • Provides limited detail • Generally maps smaller than 1:24000 are considered small scale.
Forms of Geographic Phenomena • The form is closely related to scale and may change with the level of inquiry. • At a small scale a point or line may be sufficient. At a larger scale a polygon may be more appropriate.
ACCURACY • All maps are generalizations • Too much detail for the sake of precision could overwhelm an audience • Too little attention to detail could result in inaccuracies that misinform or anger an audience • An accurate map is one that communicates the message clearly, and helps the audience understand the limitations of the data.
Geometric Accuracy The distance between the actual location of a feature and its mapped location. Most critical for larger scale maps.
Roads from USGS TIGER files 1:100,000
Roads from NJDOT 1:24000
Geometric Accuracy (cont.) • Small scale data printed on large scale maps can be coarse, oversimplified and misleading. • When digitizing from older map sources, note the risk of compounding original error with new error. • If digitizing manually make proof plots. • Note accuracy of data creation techniques: • Addressmatching +/- 200 feet • GPS +/- 15 feet
Factual Accuracy Inaccuracy in source data that cannot be corrected Use text to explain the factual limits of the map. Especially when ... • Map features have changed since data was created, and it’s not practical to update it. • Too much generalization exists, such as when the data was compiled at a smaller scale than the map. Metadata is a good source of info related to factual accuracy.
Accuracy in Classification Classification is a form of generalization, therefore it affects map accuracy. • Experiment with different classifications before deciding which one both accurately represents the data and suggests proper interpretation. • Be careful of mapping source data whose classification does not exactly fit topic of map.
Accuracy in Interpolation Interpolation is the process of deducing the unknown values that occur between points with definite values. e.g. isolines, addressmatching.
Accuracy in Interpolation (cont.) • Inform audiences that they must take care in interpreting the data. • When interpolation is especially sketchy, or if a feature is incomplete, use dashed or dotted lines to relate its approximate nature to the audience.
Accuracy in Interpretation The potential for misinterpretation by map reader Address possible uncertainty in the interpretation of data,symbols and labels. e.g. Pollution concentrations just above a standard might seem much more dangerous than ones just below the standard. Non-detectable levels may be interpreted as zero and seen as far safer than only slightly higher detectable levels.
GIS Spatial Data Standards FGDC standards have been published for documenting and testing the spatial accuracy of GIS data. 1941 - 1947 National Mapping Accuracy Standard 1994 FGDC Metadata Standard 1998 FGDC Geospatial Positioning Accuracy Standard 1998 NJDEP Electronic Data Submittal and Interchange Standard http://fgdc.er.usgs.gov/standards/standards.html
National Map Accuracy Standards Geometric Accuracy of published maps,especially federal topographic and photographic base maps NMAS Horizontal • > 1:20,000 not more than 10% test points in error by > 1/30” • < 1:20,000 not more than 10% test points in error by > 1/40” 1:12,000 - 33.3 ft 1:24,000 - 40ft 1:100,000 - 166.7ft NMAS Vertical • not more than 10% test points in error by more than 1/2 contour interval
Why a new standard is needed • NMAS focus on the accuracy of paper maps • The same processes that make digital cartography so powerful for data analysis and representation complicate accuracy assessment: • Errors can be introduced by scale variability, digitizing source materials, processing algorithms, photogrammetry, resolution, and peripheral limitations. • Collective error propagation can result in data that are oftentimes inappropriately used • Decisions made on data of known quality are made with greater confidence and are more easily explained and defended.
FGDC National Standard for Spatial Data Accuracy Geospatial Positioning Accuracy Standards • NSSDA specifies a positional accuracy test based on comparing the locations of at least 20 points between a test theme and a reference theme of higher precision. • Horizontal & Vertical Accuracy is expressed as a function of the distance error (Root-Mean-Squares Error) between the two themes (a check and reference theme) in the x- and y-coordinate directions for horizontal, and z-coordinate direction for vertical. • Threshold values are unspecified and left to the discretion of organizations
FGDC National Standard for Spatial Data Accuracy (cont.) • Suggested horizontal accuracy for large-scale maps by the American Society of Photogrammetry & Remote Sensing (ASPRS):Scale Feet1:60 0.05 1:120 0.1 1:240 0.2 1:360 0.3 1:480 0.4 1:600 0.5 1:1,200 1.0 1:2,400 2.0 1:4,800 4.0 1:6,000 5.0 1:9,600 8.0 1:12,000 10.0 1:20,000 16.7
ArcView Extension (RMSEr2.avx)Implementation of the NSSDA Test Procedure • Written by N.J.Geological Survey and distributed on www.esri.com website • Example on left shows the display of test results for a horizontal accuracy test between a 1:100,000 scale DRG base image and a DLG Hypsography theme with two sets of points checked.
Cartographic Elements . Subject Area . Title . Legend . Scale . North Arrow . Tables or supporting graphics . Border or Neatline
Subject Area The main subject should take up as much space as possible.
Title • Should clearly convey the map message • Should be direct and concise • Subtitles in smaller type can qualify or expand the statement in your title • Avoid jargon that is unknown to audiences • Avoid using the word “map” in your title • Choose a text font that is prominent and readable
Legend (key) • Describes the graphic code delivering the message • Symbols should look like counterpart on map • Can warn of uncertainty in data • Try to create symbols that don’t need a key • Use a descriptive legend heading whenever possible.
Legend Maker Extension on the tool bar that allows you to add a customized legend to your layout • Displays only those features on the layout that appear in the View. • Provides more flexibility in the way symbols are displayed.
Scale • Can use a combination of bar and verbal or bar and ratio scales. • Should not be overly large, easy to read but not prominent. • Place in a recessive location
North Arrow • Points in the direction of true north • Mandatory if north is anywhere except the top of the page • Keep small and unobstrusive
Tables or Graphics • Tables • Photos • Floor plans • Charts • Statistics Enhance map info. But don’t overwhelm the map reader.
Border • Also known as a neat line or map frame • Defines boundaries and enhances map reading • Strongly recommended for a formal presentation
Typography You must be concerned with both the content and the form of the text. • Keep all text brief but accurate • Make sure text is legible • Use no more than four fonts or text sizes on a map. • Beware of using decorative type
Typography (cont.) • Use plain text for land,italics for water • Spread the name out along the feature
Position of Map Elements • Subject Area should be large, and take up the center of the map. • Consider placing the most important cartographic elements near the top or left of the map. • Less important and supporting map elements can be positioned toward the bottom and right.
Position of Map Elements (cont.) • Title should be at the top, usually the center but sometimes to the side. • North Arrow and Legend should be to the side at the middle or bottom. • Scale usually near the bottom. • Use a style sheet when a series of related maps are being made, especially by different people.
Map Balance • Minimize white space by making the subject area as large as possible. • Title, legend, scale and north arrow should be graphically subordinate to the subject area. • Balance map elements (imagine hanging a picture). • Use the “Size & Position” option under the Graphic Menu to help balance the map.
Templates • Streamline map production • Ensure consistency of design