Download
1 / 10
100 likes | 221 Views
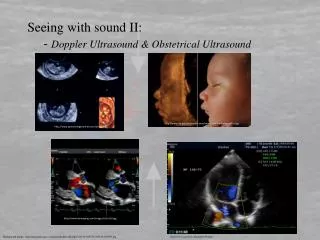
Illustrative Flow Visualization from 3D Doppler Ultrasound. Åsmund Birkeland 1 , Linn Heljesen 1,2 , Kim Nylund 2 , Dag Magne Ulvang 3 , Odd Helge Gilja 1,2 and Ivan Viola 1,3. University of Bergen (1) Haukeland University Hospital (2) Christian Michelsen Research (3) . Motivation.

E N D
Illustrative Flow Visualization from 3D Doppler Ultrasound Åsmund Birkeland1, Linn Heljesen1,2, Kim Nylund2, Dag Magne Ulvang3, Odd Helge Gilja1,2 and Ivan Viola1,3 University of Bergen (1) Haukeland University Hospital (2) Christian Michelsen Research (3)
Motivation • Blood flow imaging • What we want: • 3D Blood flow measurements • Live • Inexpensive • Non-invasive • What we have: • 4D MRI – expensive, not live • B-flow – only in 2D • CEUS – invasive • Doppler – ...
Motivation • Pros: • Inexpensive • Live • Non-invasive • Cons: • Noisy • Single component of the blood flow • Difficult to interpret for laymen
Geometry Extraction • Segmentation • Extract vessel segments during an ultrasound scan • Image based registration for fusing segments together • Vessel geometry • Extract center-line of segmented vessels • Generate a vessel-direction map based on nearest center-line point
3D Flow Reconstruction • Probe position tracked using image based registration • Reconstruction: • Flux through a cross-section: • Error dependent on
Visual Mapping • Animated particles depicting flow direction and velocity magnitude • Velocity legends for identifying velocity magnitude • Color according to flux through cross section
Results • Verification based on 4D MRI data • Accuracy: 69% for angles below 55 degrees
Future Directions • In vivo evaluation • Improve visual representation • More advanced flow model
Thank you for listening! • Questions?