Download
1 / 26
260 likes | 370 Views
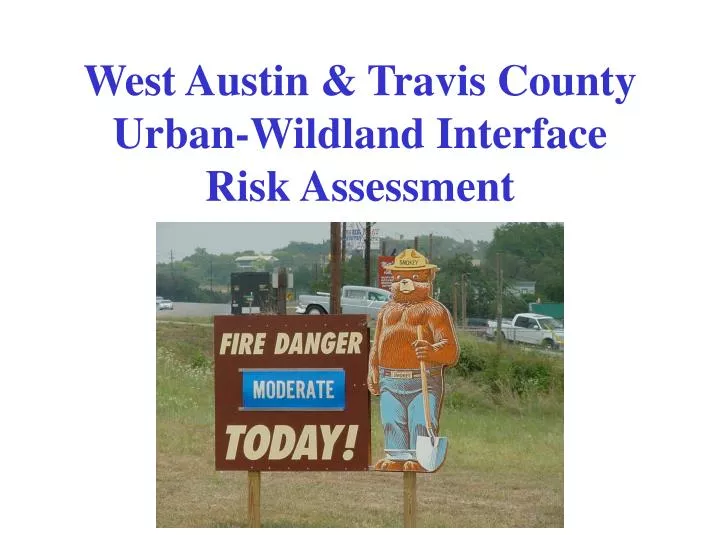
West Austin & Travis County Urban-Wildland Interface Risk Assessment. Why conduct a Risk Assessment of the WATC Interface?. Chief Warren requested a feasibility study for possible Wildland Code adoption for the City of Austin.

E N D
West Austin & Travis County Urban-Wildland Interface Risk Assessment
Why conduct a Risk Assessment of the WATC Interface? • Chief Warren requested a feasibility study for possible Wildland Code adoption for the City of Austin. • We’ve all heard that the hill country Interface is “Bad” or “Just like Oakland;” is it? • The OEM was seeking potential projects to receive FEMA grant funding via Project Impact (local hazard mitigation initiatives). • Interface fires appear to be on the rise both nationally and internationally, (is Global Warming for real??). • Dovetailed with academic pursuits.
What is the Urban-Wildland Interface?A Quick Review • “…the line, area, or zone where structures and other human development intermingle with undeveloped wildland or vegetative fuels…” • National Fire Plan, 2000 • Not to be confused with: • Intermix • Occluded
The WATC Interface represents the convergence of three Histories: • Land Management Practices: • Fire Suppression and the Oops factor of human ecological thinking…(Indians were smarter: small fire good, big fire bad) • Natural disturbance regimes interrupted • Fuel build-up • Invasion of the Ashe Juniper and other plant species • Land Use Practices: • Over grazing the land • Soil run off and grass no more • Land Development Practices: • Here come the humans…or, a room with a view would be nice…
Patterns of Development in the WATC Interface • Federal Endangered Species Act of 1973. • Golden Cheek Warbler and Black Capped Vireo are declared “endangered” • Wanna guess where their habitat is located? • WATC Hill Country (Edwards Plateau area)
Patterns of development in the WATC Interface, cont. • Texas Fish and Wildlife mitigation fee plan. • Developer donation of equivalent land. • Developer applies for FESA 10-A permit to manage habitat themselves (yea right!). • Conservancy agencies buy land outright for 10-A permit.
You’re the developer; where are you going to build and why? • Decision points: • Can’t build on slopes greater than 20%… • Humans like views…don’t want to live in a canyon… • Have to “give back” non-developable land (slopes!) or pay for mitigation to habitat… • Humans like trees, greenbelts and natural settings… • Ridges, Escarpments, Bluffs and Balconies!! • Hence the name…Balconies Canyon land Preserve…
Let’s put the dominoes in place • Land use and land management practices over time result in significant buildup in fuel complex, including fuel size, density, arrangement and species composition; • Endangered Species Act ensures that wildlands will remain wild for perpetuity with no hope for fuels management (Warbler habitat); • Humans are migrating into the hill country in droves (development); • Humans are the leading form of hostile fire ignitions known to mankind; • Homes are built on ridges, escarpments and bluffs above steep slopes of habitat and wildland areas; • Weather regimes are increasingly more erratic and pronounced, resulting in amplifications in normal fluctuations and disturbances; • There exists compelling evidence that global warming may cause significant changes in patterns of drought, heat and rain.
Formulating a Model of Risk • Stakeholder Input. • Comprehensive review of the literature. • Interviews with subject matter experts. • Extensive consultation with Texas Forest Service. • Evaluate existing models for determining risk in the interface: • Boulder • Virginia • California • Idaho • Montana • Australia
Interface Risk Triad + 1(Categories of variables) • Climate (patterns over time) • Fuels (vegetation) • Topography (slope, aspect, elevation) • Human (structure and infrastructure)
The Austin Model • Four Categories of Variables: • Event Profile (Potential for occurrence) • Temporal (Potential for ignition) • Spatial (Potential to burn) • Human (Potential consequence) • Numerical rating system with Adjectival Hazard Descriptors (Low-Extreme) based on GIS polygon, by month.
Category of Variables (I) Event Profile Category of Variables (II) Temporal Category of Variables (III) Spatial Category of Variables (IV) Human Frequency Assessment Hazard Assessment Hazard Assessment Vulnerability Assessment Potential for Occurrence Potential for Ignition Potential to Burn Potential Consequence Historical Fire Data Current and Historical Climate Data (NFDRS Outputs) Existing Fuel and Topographic Data Existing Data on “Assets” and Human Values (I)Fv= Number of fires per 7.5 min USGS Quad: (I)Fv1 = # Human ignitions (I)Fv2 = # Natural ignitions (I)Fv3 = Mean extent in Acreage (II)Tv = Mean Temporal fluctuations in climate by 28-day cycle: (II)Tv1 = 10hr dfm (1-day moisture cycle) (II)Tv2 = ERC (reaction intensity) (II)Tv3 = Burn Index (spread potential) (II)Tv4 = Ignition Component (fuel ignitability) (II)Tv5 = 1000hr dfm (drought cycle) (III)Sv = Fuels and Topo modeling by remote imagery and field research: (III)Sv1 = % Slope (fuel arrangement vis. products of combustion) (III)Sv2 = Aspect (mesic vs. xeric) (III)Sv3 = Anderson Fuel Model (Models 1, 2, 3, 4, 6, 9) (III)Sv4 = Mean distance of defensible space in poly (exposure potential) (IV)Hv = Human Vulnerability by GIS spatial analysis and field research: (IV)Hv1 = Number of structures in polygon (IV)Hv2 = Combustible construction in polygon: Roof Siding Accessories % Heat Corridor (IV)Hv3 = Mean response time in polygon (IV)Hv4 = Mean distance between structures in polygon (IV)Hv5 = Water supply (Yes/No) Probability Multiplier 375 Total Points 375 Total Points 250 Total Points
Example of Weighting System • Slope = 40% = 150 points • 0-10% = 0 • 11-20% = 15 • 21-40% = 25 • 41-50% = 45 • >50% = 65
Where to next? • Expert meeting to weight variables. • In process of collecting Frequency data. • Already collected Temporal data. • Polygons already drawn by TFS, based on fuel model (need some ground truthing). • Field research to collect Human data (any volunteers?). • Data input and hazard mapping. • Final Report.