Download
1 / 28
280 likes | 394 Views
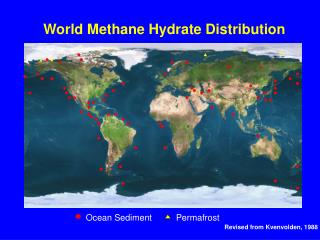
Quantifying methane hydrate saturation in different geologic settings. Gaurav Bhatnagar 1 , George J. Hirasaki 1 , Walter G. Chapman 1 Brandon Dugan 2 , Gerald R. Dickens 2 1. Dept. of Chemical and Biomolecular Engineering., Rice University 2. Dept. of Earth Science, Rice University

E N D
Quantifying methane hydrate saturation in different geologic settings Gaurav Bhatnagar1, George J. Hirasaki1, Walter G. Chapman1 Brandon Dugan2, Gerald R. Dickens2 1. Dept. of Chemical and Biomolecular Engineering., Rice University 2. Dept. of Earth Science, Rice University AGU Fall Meeting December 13, 2006
Objectives • Develop a general numerical model for simulating accumulation of gas hydrates in marine sediments over geological time scales • Use dimensionless scalings to depict hydrate saturation dependence on the large parameter set using a few simple plots
Sediment flux Us Sedimentation Sedimentation TOC α0 Seafloor Seafloor Hydrate layer extending downwards Hydrate dissociation due to burial below BHSZ Fluid flux Uf,sed Lt BHSZ BHSZ Methane solubility curve Free gas might recycle back into HSZ External flux Uf,ext Subsidence Subsidence Subsidence Time Model schematic
Outline • Phase equilibrium • Component mass balances • Simulation Results • General hydrate distributions
Methane Solubility Profile • Vertical depth normalized with the depth of the BHSZ • Methane concentration normalized with triple point solubility
Outline • Phase equilibrium • Component mass balances • Simulation Results • General hydrate distributions
Damkohler no. = Component Mass Balances - Organic • Assumptions • Sedimentation rate is constant with time • Densities of all components remain constant • Organic component advects with the sediment velocity • Organic decay occurs through a first order reaction Reaction term Convective flux Organic carbon in sediments Pe1 Peclet no. =
Component Mass Balances - Methane • Assumptions • Hydrate and gas phases form as soon as local solubility is exceeded (no kinetic limitation) • Hydrate and gas phases advect with the same velocity as the sediments
Methane Balance (contd.) β : Normalized organic content at seafloor (quantifies net carbon input from top) Pe2 : Peclet no. for external flow = = Ratio of (External Flux/Diffusion)
Outline • Phase equilibrium • Component mass balances • Simulation Results • General hydrate distributions
Outline • Phase equilibrium • Component mass balances • Simulation Results • General hydrate distributions
Parameter space for biogenic sources with Da • For each pair • of curves: • Hydrate formation with free gas below • Hydrate formation without free gas • 3. No hydrate formation
Scaling of variables • Scale x-axis to represent net methane generated within the HSZ instead of just the input • Methane generated • within HSZ (from • analytical solution • to organic balance)
Hydrate saturation distribution (biogenic) • Compute average hydrate saturation <Sh> and plot contour plots • Average hydrate saturation also scales with the scaling shown before
Hydrate saturation distribution (deeper source) • Again compute average hydrate saturation <Sh> as before • Average hydrate saturation does not scale with the scaling shown before for this case (Pe1 + Pe2) • The quantity that remains invariant in this case is the flux of hydrate, defined as Pe1<Sh> • Scales with the original choice of dimensionless groups and is plotted along contour lines
Hydrate saturations from deeper sources Contours of Pe1<Sh>
Conclusions • Better physical understanding of this system can be obtained from our general dimensionless model compared to previous site-specific models • Hydrate layer can extend down to BHSZ with free gas below or remain within HSZ with no free gas • Dependence of hydrate saturation on various parameters can be depicted using simple contour maps. This helps in summarizing results from hundreds of simulations in just two plots. • Hydrate saturation at any geological setting can be inferred from these plots without any new simulations
Financial Support: Shell Center for Sustainability & Kobayashi Graduate Fellowship