Download
1 / 19
190 likes | 294 Views
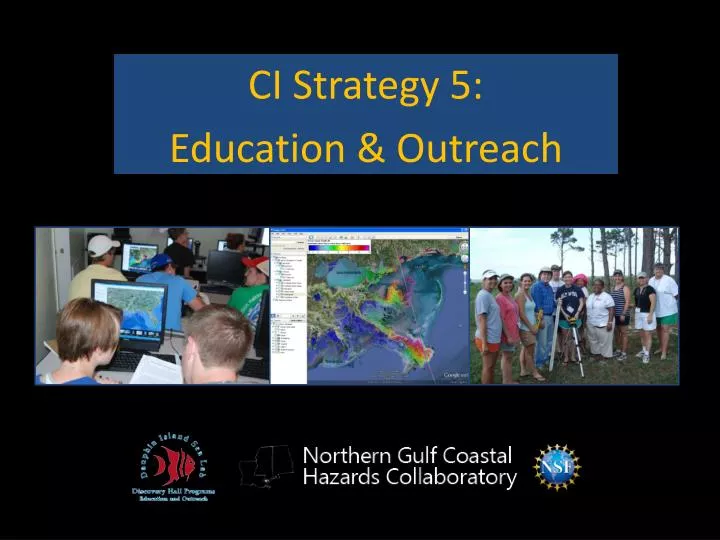
CI Strategy 5: Education & Outreach. NG CHC: Education . Educational Products Teacher Evaluations Student Evaluations Current Projects. OH! Buoy! A Data Rich Lesson Plan. Ocean science and NOAA National Data Buoy Center . Data interpretation from time series plots .

E N D
CI Strategy 5: Education & Outreach
NG CHC: Education • Educational Products • Teacher Evaluations • Student Evaluations • Current Projects
OH! Buoy! A Data Rich Lesson Plan • Ocean science and NOAA National Data Buoy Center • Data interpretation from time series plots • Hurricane tracking skills • Grades 7-12
Visualizing Hurricanes Unit A multi-day lesson utilizing Google Earth , hurricane simulations created by ADCIRC models, and the REAL tool to introduce students to scientific visualizations
Visualizing HurricanesLesson Plan Designed to aid teachers with minimal prior knowledge of lesson topics Detailed background information on hurricane science, modeling, and the REAL tool
Visualizing HurricanesLesson Plan REAL: Rapid Estimates of Approaching Landfall Storm surge visualization tool run through Google Earth
Visualizing HurricanesPowerPoint Models in science and math Hurricane science Storm surge Coastal inundation Storm Surge Math Scientific Visualizations Google Earth and the REAL tool
Visualizing HurricanesStudent Worksheets Designed to guide students through the REAL storm models with inquiry and critical thinking questions Worksheets act as a tool to demonstrate that visualizations can aid in scientific understanding
Visualizing HurricanesStudent Worksheets The REAL tool makes scientific models and visualizations approachable for the average high school student.
Visualizing HurricanesTeacher Evaluations • Respondents: 41 • Grades Taught: PreK – 12th 15 elementary, 16 middle, 6 high school, 1 teaching all grades, 3 pre-service • Subject Area: Science: 27 (66%) Self Contained (All subjects): 6 (15%) Pre-Service: 3 (7%) Gifted Education: 2 (5%) Information Technologies: 1 (2%) Social Studies: 1 (2%) No Answer: 1 (2%) • Average years in Classroom: 13.0 Range: 0 years (pre-service) – 34 years in classroom
Comfort Level Using Google Earth (before lecture) Visualizing HurricanesTeacher Evaluations Comfort Level Using Google Earth (before lecture)
Visualizing HurricanesStudent Evaluations • Participants: 110 • Grade: 9th – 12th • 77 students (70%) in 11th grade • Program: • Auburn High School Science Club: 17 (15.5%) • Baker High School Science Classes: 63 (57.2%) • Discovery Hall Programs Science Course: 30 (27.3%) • Sex: • Females: 58 (52.7%) • Males: 48 (43.6%) • No Answer: 4 (3.6%)
NG CHC Education:Next Units in Curriculum As a result of the teacher evaluations and student comments, a tutorial and lesson plan on Google Earth basics is currently being created. Expanding the hurricane unit to include 10 model storms with accompanying student activities. The model storms vary in intensity and strike the Northern Gulf coast from Louisiana to Mobile Bay.
NG CHC Education:Next Units in Curriculum • Stormsurge.disl.org • Lesson on Models • Electronic and paper files --> Online Module • Interactive, web based program for simplified hurricane models (Carsten Neumann, ULL) • Collaboration with new NG CHC visualization products
Thanks to: • National Science Foundation EPSCoR Grant Numbers EPS- 1010640, EPS-1010607, # EPS-1010578 and by the states of Louisiana, Alabama and Mississippi. • Tom Richardson, JSU, MS • Dr. HimangshuDas, JSU, MS • Teachers in workshops and students in classes that tested the lesson plans