Download
1 / 9
90 likes | 189 Views
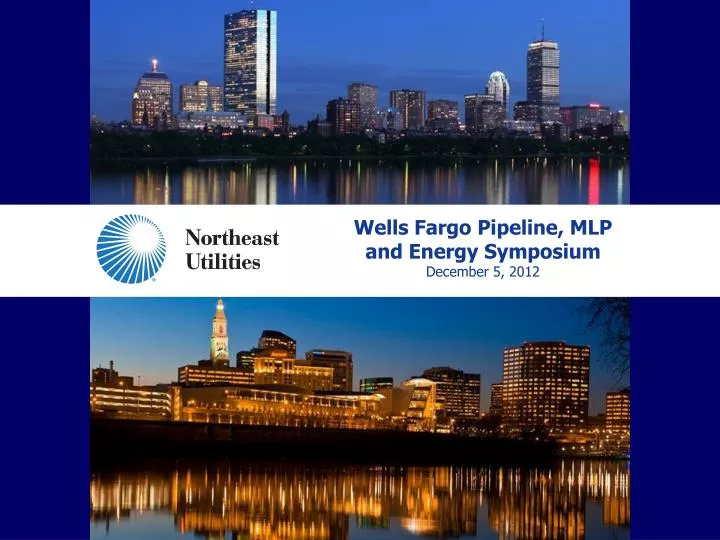
Wells Fargo Pipeline, MLP and Energy Symposium December 5, 2012. NU Safe Harbor Provisions.

E N D
Wells Fargo Pipeline, MLP and Energy SymposiumDecember 5, 2012
NU Safe Harbor Provisions • This presentation includes statements concerning NU’s expectations, beliefs, plans, objectives, goals, strategies, assumptions of future events, future financial performance or growth and other statements that are not historical facts. These statements are “forward-looking statements” within the meaning of the Private Securities Litigation Reform Act of 1995. In some cases, a listener or reader can identify these forward-looking statements through the use of words or phrases such as “estimate,” “expect,” “anticipate,” “intend,” “plan,” “project,” “believe,” “forecast,” “should,” “could,” and other similar expressions. Forward-looking statements involve risks and uncertainties that may cause actual results or outcomes to differ materially from those included in the forward-looking statements. Factors that may cause actual results to differ materially from those included in the forward-looking statements, include, but are not limited to, actions or inaction of local, state and federal regulatory and taxing bodies; changes in business and economic conditions, including their impact on interest rates, bad debt expense and demand for NU’s products and services; changes in weather patterns; changes in laws, regulations or regulatory policy; changes in levels or timing of capital expenditures; disruptions in the capital markets or other events that make NU’s access to necessary capital more difficult or costly; developments in legal or public policy doctrines; technological developments; changes in accounting standards and financial reporting regulations; fluctuations in the value of our remaining competitive contracts; actions of rating agencies; the possibility that expected merger synergies will not be realized or will not be realized within the expected time period; and other presently unknown or unforeseen factors. Other risk factors are detailed from time to time in NU’s and NSTAR’s reports filed with the Securities and Exchange Commission. Any forward-looking statement speaks only as of the date on which such statement is made, and NU undertakes no obligation to update the information contained in any forward-looking statements to reflect developments or circumstances occurring after the statement is made or to reflect the occurrence of unanticipated events. • All per share amounts in this presentation are reported on a diluted basis. The only common equity securities that are publicly traded are common shares of NU parent. The earnings and EPS of each business do not represent a direct legal interest in the assets and liabilities allocated to such business, but rather represent a direct interest in NU's assets and liabilities as a whole. EPS by business is a non-GAAP (not determined using generally accepted accounting principles) measure that is calculated by dividing the net income or loss attributable to controlling interests of each business by the weighted average diluted NU parent common shares outstanding for the period. In addition, the third quarter and nine months ended September 30, 2012 and 2011 earnings and EPS excluding certain charges related to the April 10, 2012 closing of the merger between NU and NSTAR are non-GAAP financial measures. Management uses these non-GAAP financial measures to evaluate earnings results and to provide details of earnings results by business and to more fully compare and explain NU’s third quarter and nine months ended September 30, 2012 and 2011 results without including the impact of the non-recurring merger and related settlement costs. Management believes that these non-GAAP financial measures are useful to investors to evaluate the actual and projected financial performance and contribution of NU’s businesses. Non-GAAP financial measures should not be considered as alternatives to NU consolidated net income attributable to controlling interests or EPS determined in accordance with GAAP as indicators of NU’s operating performance. 2
New NU Has Extensive Scale and Scope • Combined, the new NU is now: • Providing reliable electric & gas service to: • 3.5 million electric and gas customers • Leveraging investments for our customers & shareholders: • $12.4 billion combined rate base (2011) • Serving 525 cities & towns throughout New England • Regulated companies: • Four electric companies • Two gas companies • One three-state electric transmission business 3
NEEWS:The Greater Springfield Reliability Project – A Case Study In NU’s Transmission Development Expertise Under Construction Continued strong relationships and frequent communications with affected communities Greater Springfield Reliability Project (GSRP) • Projected in-service: late 2013 • Total projected NU cost: $718 million • Project approximately 92% complete as of 11/30/12 GSRP: Massive Scale and Scope • 38 linear miles spanning 2 states and 8 towns • 100 transmission circuit miles • 600 structures • 13 substations and switching stations (new/rebuilt)
NEEWS: Interstate Reliability Project • Interstate Reliability Project • Joint project with National Grid (NU in CT; NGrid in MA & RI) • All major permit applications filed • CT siting hearings are complete with decision in early 2013 • Projected commencement of construction: late 2013/early 2014 • Projected in-service: late 2015 • Total projected NU cost: $218 million
NEEWS: Greater Hartford Central Connecticut Project (GHCC) • The 345-kV Central Connecticut Reliability Project (CCRP) was designed to address east-to-west power flow constraints across CT • As expected, ISO has issued its need reassessment for CCRP, expanding the study to include other electricity connected areas inside CT – project is now named the GHCC • ISO-NE presented the preliminary need results of this GHCC study to the Planning Advisory Committee in August 2012 • The results show severe thermal overloads and voltage violations in each of the four study areas • 345-kV and 115-kV solutions are being considered to correct these reliability violations • ISO process expected to provide preferred transmission solutions in 2013 • The previously estimated $300M cost, with a 2017 in-service date, is a good placeholder for the GHCC solutions
Northern Pass Transmission Project Overview • 1,200 MW clean energy • $1.1 billion HVDC line, terminal and AC facilities • Participant-funded structure; no impact on the Regional Transmission Rate • Uses HVDC technology at +/- 300-kV with AC/DC converters in Quebec and NH • AC radial 345-kV line to connect to the New England bulk power grid • Approximately 180 miles of new transmission (140 HVDC, 40 AC) • Provides significant benefits to the region • Energy value through reduced wholesale market prices - $200-$300 million per year for New England • Environmental value through carbon emissions reductions – up to 5 million tons of CO2 reduction • Economic value through construction jobs and new tax base – 1,200 jobs and $25 million per year in property taxes Des Cantons (Quebec) Franklin (New Hampshire) Deerfield (New Hampshire) HVDC Line 345-kV AC Line HVDC Line terminations 345-kV AC line termination
Transmission’s Projected Capital Investment Has Grown by $700M to $3.7B from Last Year’s Forecast Budget Forecast Northern Pass HVDC Line to Canada Historic $718M $3.7 Billion $3.5 Billion US portion estimated at $1.1B; $1.04B in forecast period Successful completion of SWCT projects NEEWS projects progressing NU’s share of NEEWS project estimated at $1.27B; $569M in forecast period SWCT projects total $1.6 billion In Millions SEMA Cape Cod $149M Boston Network Improvements $126M Greater Boston Reliability $353M $1.47 Billion of additional forecasted reliability projects
Transmission Rate Base Growth Projections 10% CAGR $6,811 $6,636 $5,424 $4,991 $4,613 $4,214 $3,823 $ in millions 9