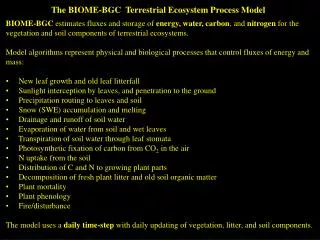
Download
1 / 41
450 likes | 862 Views
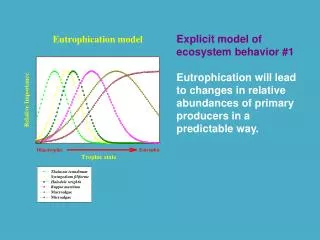
CENTURY ECOSYSTEM MODEL. Introduction to CENTURY. WHY CENTURY. Evaluate Effects of Environmental Change Evaluate Changes in Management. What is CENTURY?. Simple Ecosystem Model Soil Organic Matter Plant Production Hydrological Nutrient Cycle. Why CENTURY was developed.

E N D
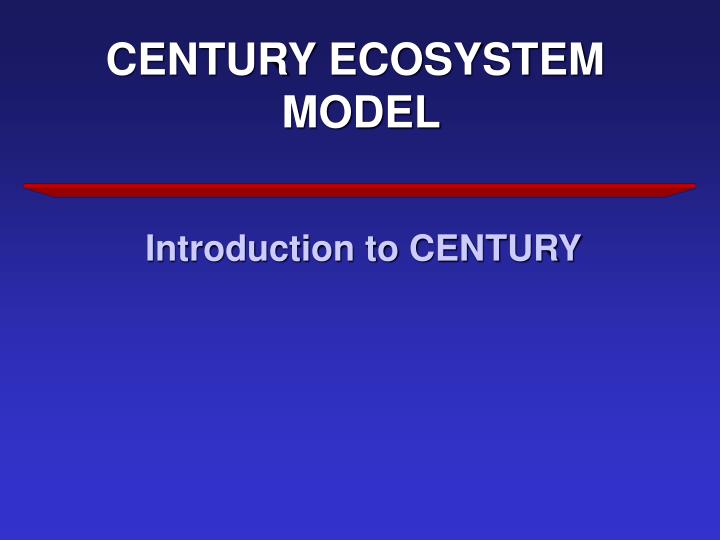
CENTURY ECOSYSTEM MODEL Introduction to CENTURY
WHY CENTURY Evaluate Effects of Environmental Change Evaluate Changes in Management
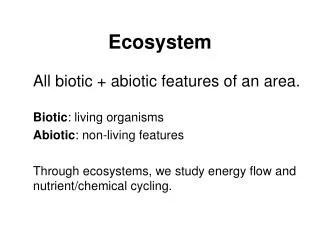
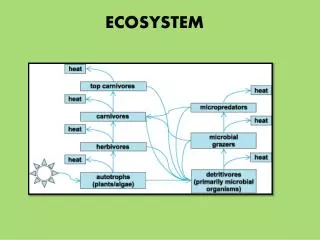
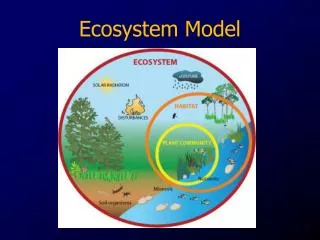
What is CENTURY? Simple Ecosystem Model Soil Organic Matter Plant Production Hydrological Nutrient Cycle
Why CENTURY was developed From early experience (1970’s) of attempting to model everything (e.g. IBP) an understanding of the inherent problems of scaling processes and components within appropriate time and spatial scales for a specific set of questions or hypotheses
MODEL DEVELOPMENT • Development of CENTURY of biogeochemical cycles of C, N, P, and S for various ecosystem found globally was undertaken in order to provide adequate process-level representation of key transfers of material from critical ecosystem components. • Soil Organic Matter (SOM) was the focus of the model development because of the integration of ecosystem processes and environmental changes which is represented in SOM. • Environmental and land management factors can be easily incorporated into the simulations of SOM development. • Input parameters be meaningful in ecological terms and easily acquired from existing data bases or experimentally determined.
MODEL STRUCTURE Structure based on turnover rates of SOM pools THREE TYPES OF SOM POOLS ACTIVE: Live microbes and their by- products (2 to 5 year turnover) SLOW: Physically and chemically protected (20 to 50 years turnovers) PASSIVE: Physically protected or chemically resistant SOM (800 to 1200 year turnover)
MODEL CONTROLS Monthly inputs of temperature and rainfall Soil properties easily defined Plant system controlled by T, H2O, and nutrient availability Land management practices modifies ecosystem processes Hydrological input-output processes represented
WHY MODEL? • Provides a conceptual framework from which to pose hypotheses • Provides a mechanism to test a set of complex hypotheses • Provides insight into methods of field/lab testing model predictions
SUMMARY • CENTURY IS A TOOL FOR ANALYSIS OF CONTROLS ON SOIL ORGANIC MATTER AND PRODUCTIVITY • SIMULATION RESULTS DEMONSTRATE HOW INPROVED MANAGEMENT PRACTICES CAN ARREST ORGANCI MATTER LOSSES AND IMPROVE DEGRADED SOILS THROUGH: • Higher yielding varieties • Reduced soil disturbance • Maintenance of crop residues • Replacement of nutrient losses
Observed above ground NPP for various global sites vs. CENTURY modeled abiotic decomposition factor (DEFAC).
Impact of mineral N on soil C/N ratios for grasslands and forests.
Effect of initial litter N content on litter carbon and N mineralization.
Live forest C/N ratio as a function of ratio of available plant N to potential plant N demand.
Allocation of N to trees vs. grass as a function of tree basal area and SITPOT.
Comparison of simulated and observed live biomass for (a) Kenya, (b) Lamto, (c) Mexico, and (d) Thailand sites.
Comparison of observed and simulated aboveground plant production.
Comparison of observed and simulated soil C (0-30 cm) and soil N (0-30 cm).
Nitrification and denitrification N gas flow diagram. (Del Grosso et al. 2001)
Comparison of simulated changes in soil C, integrated C equivalents of N2O emissions and net C for a conventional tillage winter wheat/fallow system (ww), no till winter wheat fallow (wwnt), irrigated corn, and reversion to native grass for 25 year periods following 75 years of conventional till winter wheat/fallow land use. Negative values represent uptake of greenhouse gases by the soil. (From Del Grosso et al. 2001) D S S D S S S
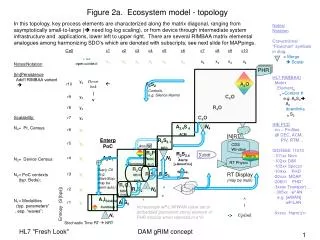
The CENTURY model environment showing the relationship between programs and the file structure.