Download
1 / 42
420 likes | 584 Views
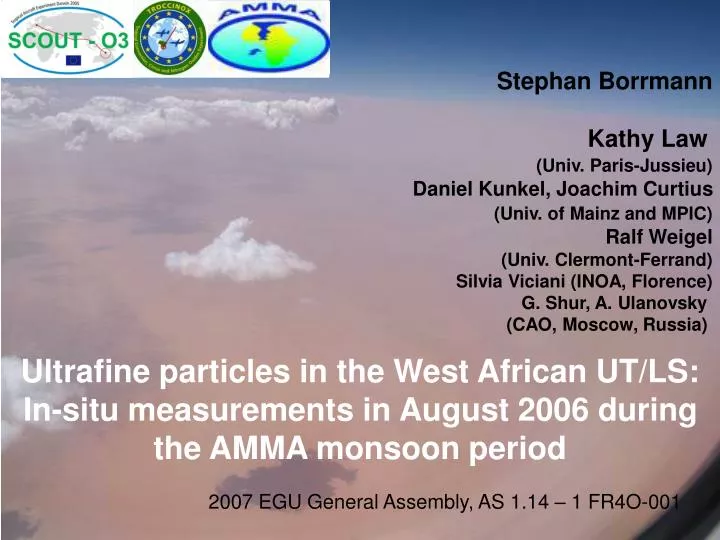
Stephan Borrmann Kathy Law (Univ. Paris-Jussieu) Daniel Kunkel, Joachim Curtius (Univ. of Mainz and MPIC) Ralf Weigel (Univ. Clermont-Ferrand) Silvia Viciani (INOA, Florence) G. Shur, A. Ulanovsky (CAO, Moscow, Russia).

E N D
Stephan Borrmann Kathy Law(Univ. Paris-Jussieu) Daniel Kunkel, Joachim Curtius(Univ. of Mainz and MPIC)Ralf Weigel (Univ. Clermont-Ferrand) Silvia Viciani (INOA, Florence)G. Shur, A. Ulanovsky (CAO, Moscow, Russia) Ultrafine particles in the West African UT/LS: In-situ measurements in August 2006 during the AMMA monsoon period 2007 EGU General Assembly, AS 1.14 – 1 FR4O-001
(1) Instrument: COPAS on Russian high altitude research aircracft M-55 „Geophysica“
Specialized CPC type COndensation PArticle counting System heated channel (250°C) • Condensable • liquid: Fluorinert - 1 Hz data - 10% - isokinetic inlet < 1µm unheated channel
COPAS Deliverables 1 Hz time series/vertical profilesup to 20 km of particle # / cm³ * for sizes > 6 nm * for size diam. > 10 nm * for size diam. > 14 nm * above 10 nm after heating to 250 °C => non volatile residue * derived: Fraction f of non volatile to total # for > 10 nm
UMAINZ/MPIC instrumentation on „Geophysica“ 2 Modified FSSP-SPP100 1 Cloud Imaging Probe CIP 2 COPAS units COPAS I COPAS II
(2) Results: „Global“ background aerosol between potentialtemperatures Θof 367 K and 460 K
TROCCINOX, SCOUT-O3, AMMA transfer flights VeronaItaly MarrakeshMarocco OuagadougouBurina Faso AccraGhana Latitude range: 55 °N to 20 °S , Jan 2005 until Aug 2006, no major volcano eruption
Marrakech-Ouagadougou Pressure hPa] „Cold“ 10 nm channel Heated 10 nm channel
-●- n6 TROCCINOX–Transfer Germany - Brazil -●- n6 SCOUT – Transfer Germany - Australia AMMA transfer Θ, altitude range ≈ 367 K to 460 K ≈ 12 km to 17 km
(3) Results: Vertical profiles Mid-latitudes, Brazil, Australia, West-Africa
-●- EUPLEX- Test, Forli, 2002 ―CN, Laramie, USA, Deshler et al. 2003 ● Marshal Test flight, OPH 2005 ● SCOUT-Transfer, OPH - Larnaca, 2005 ● SCOUT-Transfer, Larnaca - OPH, 2005 -●- AMMA 2006, mid-latitude flights Remar- kably konstant from 1999 until 2006 2005, 48°N July 2006 200535°N Mid latitude vertical profiles 2002 to 2006 2005 2002, 44°N 1999, 41°N
COPAS-data vs altitude particle sizes > 6 nm 1 µm SCOUT-O3 transfer flightsGermany – Australia Nov. and Dec. 2005 Stratospheric compactness ● 04.11.2005 OPH - Larnaca ● 04.11.2005 Larnaca - Dubai ● 07.11.2005 Dubai – Hyderabad ● 09.11.2005 Hyderabad – U-Tapao ● 11.11.2005 U-Tapao - Brunei ● 12.11.2005 Brunei – Darwin ● 09.12.2005 Darwin - Brunei ● 10.12.2005 Brunei – U-Tapao ● 13.12.2005 U-Tapao – Hyderabad ● 14.12.2005 Hyderabad - Dubai ● 16.12.2005 Dubai - Larnaca ● 17.12.2005 Larnaca - OPH Tropospheric variability
SCOUT-O3 local flightsDarwin, Australia COPAS-data vs altitude particle sizes > 6 nm 1 µm Contrail crossing ? ● 16.11.2005 ● 19.11.2005 ● 23.11.2005 ● 25.11.2005 ● 29.11.2005 ● 30.11.2005 A ● 30.11.2005 B ● 05.12.2005
COPAS-data vs altitude particle sizes > 6 nm 1 µm ● n10 non-volatile ● n10 total ● n14 ●n6 -●- median n10 AMMA local flightsOuagadougou: * Unusual increase above 450 K* Compact data with very little scatter* No nucleation particles Potential Temperature [K] Particle number concentration [cm³]
Context of other tropical data from „Geophysica“: Vertical profilesTropical Brazil, Australia, West-Africa => W. African profile IS unusual. Darwin Amma Brazil Potential temperature [K] Brock, 1995 Particle mixing ratio [#/mg]
All AMMA flights: Red: θ = 500 KBlue: θ = 350 K „Anomaly“ also in „N2O space“
Except AMMA all data from Chuck Wilson, Denver University, ER-2 and WB-57 tropical measurements from 1996 onward Potential temperature [K] Context with other tropical data Ultrafine particle mixing ratio [#/mg of air]
(4) Results:nonvolatile ultrafine particles ( >10 nm and 1 µm ) (nonvolatile) particle number above 10 nm per cm³ of air (250 °C) f= total particle number density > 10 nm (ambient temperature) nonvolatile residues » « = ambient particles
Striking increase inside 2003 arctic vortex above400 K Mid latitudes ― Brock et al. (1995) outside tropics -●- COPAS n10 – median (2002) Arctic Latitudes -●- COPAS n10 inside polar vortex (2003) -○- COPAS n10 outside polar vortex (2003) Tropics ― Brock et al. (1995) inside tropics -●- COPAS n10 Brasil (2005) -●- COPAS n10 Australia (2005)
Ratio of non-volatile particle number to total particle number > 10nm, < 1 µm EUPLEX 2003 EXAMPLE: Arctic data 2003 high fraction of non-volatile particles inside Arctic vortex (~70 %) => subsidence of meteoritic materialfrom mesosphere Curtius et al., ACP, 2005
Striking increase inside 2003 arctic vortex above400 K Explained by IMPORT of meteoric dust from the mesosphere throughanalysis of non-volatility Mid latitudes ― Brock et al. (1995) outside tropics -●- COPAS n10 – median (2002) Arctic Latitudes -●- COPAS n10 inside polar vortex (2003) -○- COPAS n10 outside polar vortex (2003) Tropics ― Brock et al. (1995) inside tropics -●- COPAS n10 Brasil (2005) -●- COPAS n10 Australia (2005)
Ratio of non-volatile particle number to total particle number > 10nm, < 1 µm TROPICAL BRASIL Non-volatile particles constant at 20-30% in LS More variable, but typically ~10% in TTL and below. 2005 0123 - 0227
Ratio of non-volatile particle number to total particle number > 10nm, <1 µm AUSTRALIA 2005 Slightly higher level (10%) of non-volatile particles over the continent than above the sea continental Australia tropical „oceanic“ Australia
4.8.2006 8.8.2006 11.8.2006 AMMA: Ouaga ratio of non volatile particles to total number * Values above 360K are at 50%. * Tropical Brazil was 20%. * Tropical Australia 60% but higher up.
„Sulfuric acid region“ „Region of high non volatility“ „Tropospheric variability region“ AMMA summary: COPAS-data vs altitude particle sizes > 6 nm 1 µm Ouagadougou local flights Potential Temperature [K] ● n10 non-volatile ● n10 total ● n14 ●n6 -●- median n10 Particle number concentration [cm³]
(5) Results fromspecific cases: Biomass burning particles
High CO for biomass burningis correlated with high ultrafine particle Number densities
AMMA flight August 8, 2006 High CO for biomass burningis correlated with high non-volatile ultrafine particle component Theta: Blue 370 K Grey 385 K Yellow 400 K Red 430 K
Difference between n6 and n14 is zero. Thus: no new particle formationin bmb plume above Accra Biomass burning:Vertical profilesover Accra, August 13, 2006
Non volatile component f≈ 30% at 13 km altitude Homogeneous Nucleation Direct evidence for homogeneous nucleation in the tropics Flight altitude in km ●n6 ●n15 – altitude Only ultrafine particles 6 nm size 14 nm Particle number density in cm-3 TROCCINOX, BRAZIL, 24.2.2005 UTC flight time [hours]
Biomass burning: Vertical profiles over Accra, August 4, 2006
Large latitudinal data sets on non-volcanic background ultrafine particles within 2005 through TROCCINOX, SCOUT-O3, AMMA mid-lat. transfer, survey, test flights. • For AMMA unexpected increase above 420 K => No explanation sofar. • Non-volatility vs. total aerosol number ratios between 20% and 80%, maximum near 400 K => No explanation for this profile sofar. • Above ≈ 400 K ultrafine particle numbers constant since 1999 at mid-latitudes Summary
Thanks for your interest.
Heater efficiency of COPAS I at 250°C with pure H2O- H2SO4- particles Boiling point of H2O- H2SO4 particles under pressure conditions at 10 – 20 km: ~ 150°C (Rosen, 1971) ○ 300 hPa ∆ 150 hPa ◊ 70 hPa particle number density in cm-3 (linear) particle number concentration in cm-3 (log) H2SO4/H2O 150nmparticles with 0.5% by volumenonvolatile component willbe detected as„non-volatile“. ● not heated channel ● heated channel at 250°C particle diameter in nm
SCOUT-O3 Australia 2005 Hector Cb-cloud flights vs. continental Australia flight ●Hector flight, 25.11.2005 ●Hector flight, 30.11.2005 A ● Hector flight, 30.11.2005 B ● ENVISAT flight, 05.12.2005
Red : Darwin Dec. 2005 Green: Aracatuba, Brazil Feb 2005 Black: mid-latblue: arctic COPAS n > 10 nm
EXAMPLE:Arctic data 2003 Correlation of ultrafine particles with long lived tracer N2O Curtius et al., ACP, 2005 N2O mixing ratio in [ ppbv ] Import of ultrafine nuclei from high altitudes inside polar vortex Particle number mixing ratio in [ # / mg ]
● n10 non-volatile ● n10 total -○- median n10 Verona Are data ok ? Mid-latitude parts of AMMA transfer consistent with other profiles. Marrakech Marrakech