Download
1 / 61
610 likes | 716 Views
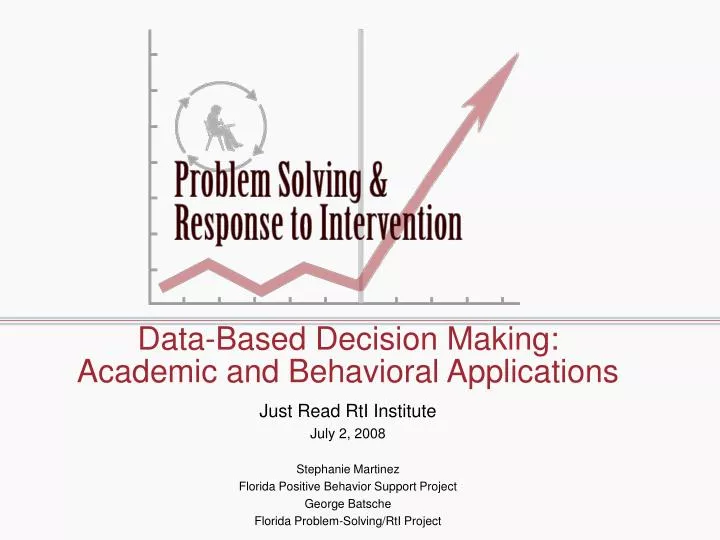
Data-Based Decision Making: Academic and Behavioral Applications. Just Read RtI Institute July 2, 2008 Stephanie Martinez Florida Positive Behavior Support Project George Batsche Florida Problem-Solving/RtI Project. What is RtI?.

E N D
Data-Based Decision Making:Academic and Behavioral Applications Just Read RtI Institute July 2, 2008 Stephanie Martinez Florida Positive Behavior Support Project George Batsche Florida Problem-Solving/RtI Project
What is RtI? RTI is the practice of (1) providing high quality instruction/intervention matched to student needs and, (2) using level of performance and learning rate over a time to (3) make important educational decisions to guide instruction. National Association of State Directors of Special Education, 2005
Core Principles of RtI • Frequent data collection on student performance • Early identification of students at risk • Early intervention (K-3) • Multi-tiered model of service delivery • Research-based, scientifically validated instruction/interventions • Ongoing progress monitoring - interventions evaluated and modified • Data-based decision making - all decisions made with data
Three Tiered Model of School Supports: Example of an Infrastructure Resource Inventory Academic Systems Behavioral Systems Tier III: Comprehensive and Intensive Interventions ( Few Students) Students who need Individualized Interventions Tier III: Intensive Interventions ( Few Students) Students who need Individual Intervention Tier II: Strategic Interventions (Some Students) Students who need more support in addition to the core curriculum Tier II: Targeted Group Interventions (Some Students) Students who need more support in addition to school-wide positive behavior program Tier I: Universal Interventions All students; all settings Tier I: Core Curriculum All students 4
How Does it Fit Together?Standard Treatment Protocol Results Monitoring Addl. Diagnostic Assessment Instruction All Students at a grade level Individualized Intensive Individual Diagnostic Intensive 1-5% weekly Small Group Differen- tiated By Skill Supplemental 5-10% Standard Protocol Behavior Academics 2 times/month Core Bench- Mark Assessment Annual Testing ODRs Monthly Bx Screening None Continue With Core Instruction Grades Classroom Assessments Yearly Assessments 80-90% Step 2 Step 3 Step 4 Step 1
Data-Based Decision Making:Critical Issues • Accurate Problem Identification • Selection of Appropriate Data • Accurate Data Collection • Graphic Display • Consistent Decision Rules • Data for Intervention Documentation
Levels of Data Collection School Wide Tier 1 Class Wide Tier 1 Individual Students Tier 2 and/or Tier 3
Accurate Problem Identification • Use of desired “Replacement Behaviors” • Academic • State Approved Grade-Level Benchmarks • E.g., words correct per minute, % comprehension, content on common assessments (high school), math problems correct • Behavior • Prosocial behaviors that promote academic performance • E.g., % points, % work completed, requesting assistance, per student rate of specific office discipline referrals
Accurate Problem Identification • Data Necessary for Problem-Solving/RtI • Current level of performance • Academic • 47 words correct/minute • Behavior • 50% of work completed • Desired level of performance (benchmark/goal) • Academic • 75 words correct/minute • Behavior • 75% of work completed • Peer level of performance (by demographic) • Academic • 75 words correct/minute • Behavior • 80% work completed • Gap levels
Selection of Appropriate Data • Directly related to academic or behavior goal • Benchmark data related to grade level standards • Discipline referrals related to academic engaged time • Easily measured • Collected frequently • Sensitive to small changes in behavior
Graphic Display • Current Level of Performance • Desired Level of Performance • Aim Line-Desired Rate of Improvement • Trend Line-Actual Rate of Improvement • Time to Goal
Decision Rules: What is a “Good” Response to Intervention? Positive Response Gap is closing Can extrapolate point at which target student(s) will “come in range” of target--even if this is long range Questionable Response Rate at which gap is widening slows considerably, but gap is still widening Gap stops widening but closure does not occur Poor Response Gap continues to widen with no change in rate.
Positive Response to Intervention Expected Trajectory Performance Observed Trajectory Time
Decision Rules: What is a “Questionable” Response to Intervention? Positive Response Gap is closing Can extrapolate point at which target student(s) will “come in range” of target--even if this is long range Questionable Response Rate at which gap is widening slows considerably, but gap is still widening Gap stops widening but closure does not occur Poor Response Gap continues to widen with no change in rate.
Questionable Response to Intervention Expected Trajectory Performance Observed Trajectory Time
Decision Rules: What is a “Poor” Response to Intervention? Positive Response Gap is closing Can extrapolate point at which target student(s) will “come in range” of target--even if this is long range Questionable Response Rate at which gap is widening slows considerably, but gap is still widening Gap stops widening but closure does not occur Poor Response Gap continues to widen with no change in rate.
Poor Response to Intervention Expected Trajectory Performance Observed Trajectory Time
Positive Questionable Poor Response to Intervention Expected Trajectory Performance Observed Trajectory Time
Decision Rules: Linking RtI to Intervention Decisions Positive Continue intervention with current goal Continue intervention with goal increased Fade intervention to determine if student(s) have acquired functional independence.
Decision Rules: Linking RtI to Intervention Decisions Questionable Was intervention implemented as intended? If no - employ strategies to increase implementation integrity If yes - Increase intensity of current intervention for a short period of time and assess impact. If rate improves, continue. If rate does not improve, return to problem solving.
Decision Rules: Linking RtI to Intervention Decisions Poor Was intervention implemented as intended? If no - employ strategies in increase implementation integrity If yes - Is intervention aligned with the verified hypothesis? (Intervention Design) Are there other hypotheses to consider? (Problem Analysis) Was the problem identified correctly? (Problem Identification)
Sources of Data:Tier 1 Academic • FCAT: % Proficient • Universal Screening • Benchmark • District-Wide Assessments • Common Assessments
Possible Sources of Data: Tier 1 Behavior Progress Monitoring Benchmarks of Quality (BoQ) School-wide Evaluation Tool (SET) Office Discipline Referrals (ODRs) Per Day/Per Month Location Time Grade level Student, Staff Problem Behavior • Attendance • ESE referrals • OSS/ISS • Classroom walk-through assessments (formal, informal)
Possible Sources of Data: Tier 1 Behavior Screenings for Tier 2 Systematic Screening for Behavior Disorders (SSBD) Achenbach System of Empirically Based Assessment (ASEBA) Attendance ODRs ISS/OSS Teacher Nomination
Office Discipline Referrals Student 31
Tier 1 Behavior Decision Points Tier 1 School-wide or Universal/Core • If score on Benchmarks of Quality (BOQ) is less than 70, then revisit SWPBS or look at Classroom • If our discipline date indicate an increase in ODR/ISS/OSS, then revisit SWPBS • If score on Benchmarks of Quality (BOQ) is greater than 70, and data show a increasing trend in ODR/ISS/OSS, then revisit SWPBS or look at Classroom • If score on Benchmarks of Quality (BOQ) is greater than 70 and data show a decreasing trend in ODR/ISS/OSS, then look at data to determine if need training at Targeted Group and/or Individual level PBS
Possible Sources of Data: Tier 1/2 Behavior Identification & Progress Monitoring, Classroom Level • Classroom Assessment Tool • Informal “walk-throughs” • Formal observations of classroom
Tier 1/2 Behavior Decision Points Tier 1/2 Classroom Support • If most of ODRs (over 50%) are coming from many classrooms, then revisit SWPBS application in all classrooms • If a few classrooms are responsible for the majority of ODRs, then look at Classroom PBS using the Classroom Consultation Guide • If score on Benchmarks of Quality (BOQ) is less than 70, then revisit SWPBS or look at Classroom PBS using the Classroom Consultation Guide • If our discipline data indicate an increase in ODR/ISS/OSS and most of the referrals are coming from many classrooms, then revisit SWPBS application in all classrooms • If a classroom has received support, the interventions were done with fidelity and the behavior of the student has not improved, then consider Tier 2 supports for the student
Decision Model at Tier 1- General Education Instruction • This Student is at Risk, General Education Not Working Elsie • Step 1: Screening • ORF = 62 wcpm, end of second grade benchmark for at risk is 70 wcpm (see bottom of box) • Compared to other students, Elsie scores around the 12th percentile + or - • Elsie’s teacher reports that she struggles with multisyllabic words and that she makes many decoding errors when she reads • Is this student at risk? Continue Tier 1 Instruction No Yes Move to Tier 2: Strategic Interventions
Sources of Data:Tier 2 Academic • Benchmark Data • Progress Monitoring Data • Small Group and/or Individual Student
Possible Sources of Data: Tier 2 Behavior Identification, Student Level • Teacher Nomination process • Normed behavior rating scales (SSBD, ASEBA) • ODRs/Discipline data • By student • Requests for assistance • Achievement data • Progress Monitoring, Student Level • Behavior Report Cards/Teacher rating scales • Frequency counts (teacher, student)
Adapted from Crone, Horner & Hawken (2004) HR 1st 2nd 3rd 4th L 5th 6th BE RESPECTFUL BE RESPONSIBLE BE PREPARED Points Possible: ______ Points Received: ______ % of Points: ______ Goal Achieved? Y N Daily Progress Report Name: __________________________ Date: ____________ Rating Scale:3=Good day2=Mixed day1=Will try harder tomorrow GOALS: List Behavior: List Behavior: List Behavior: Teacher Comments: I really like how… ____________________________________________________________________________________________________________________________________________________________________________________________________________________________________________________________________________________________________________________________ Parent Signature(s) and Comments: _______________________________________________
Tier 2 Behavior Decision Points Tier 2 Targeted Group Support/Supplemental • If a student is identified as needing Tier 2 supports but has not had contact with SWPBS (i.e. teaching, rewarding), then either revisit SWPBS and/or receive Classroom PBS • If a student is identified as needing Tier 2 supports and has had contact with SWPBS (i.e. teaching, rewarding), then identify appropriate Tier 2 supports • If a student receiving Tier 2 supports is consistently reaching his/her goals, then decide to either maintain/begin to fade Tier 2 or move back to Tier 1 supports • If astudent in Tier 2 supports is consistently not reaching their goals, then need to first make sure the student was receiving the support with fidelity or adapt the Tier 2 supports to be more effective • If astudent in Tier 2 supports is consistently not reaching their goals and Tier 2 support was delivered with fidelity, then need to either decide to try another Tier 2 support, have a teacher consultation or move to Tier 3. You may also want to initiate the FBA/BIP process.
Sources of Data:Tier 3 Academic • Benchmark Data • Progress Monitoring Data • Universal Screening • Diagnostic Assessments • Few Students and/or Individual Student
Aimline= 1.50 words/week Trendline = 0.2.32 words/week
Decision Model at Tier 3- Intensive Intervention & Instruction • Step 3: Is student responsive to intervention at Tier 3? • ORF = 45 wcpm, winter benchmark (still 4 weeks away) for some risk = 52 wcpm • Target rate of gain over Tier 2 assessment is 1.5 words/week • Actual attained rate of gain was 2.32 words/week • At or above comprehension benchmarks in 4 of 5 areas • Student on target to attain benchmark • Step 3: Is student responsive to intervention? • Move student back to Strategic intervention Continue monitoring or return to Tier 2 Steven Move to Sp Ed Eligibility Determination Yes No
Aimline= 1.50 words/week Trendline = 0.95 words/week