Download
1 / 27
270 likes | 375 Views
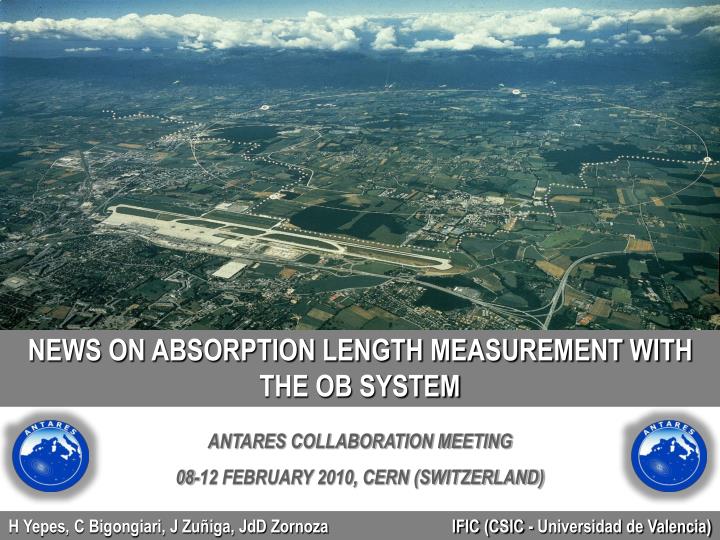
NEWS ON ABSORPTION LENGTH MEASUREMENT WITH THE OB SYSTEM. ANTARES COLLABORATION MEETING 08-12 FEBRUARY 2010, CERN (SWITZERLAND). H Yepes, C Bigongiari, J Zuñiga, JdD Zornoza IFIC (CSIC - Universidad de Valencia). OUTLINE.

E N D
NEWS ON ABSORPTION LENGTH MEASUREMENT WITH THE OB SYSTEM ANTARES COLLABORATION MEETING 08-12 FEBRUARY 2010, CERN (SWITZERLAND) H Yepes, C Bigongiari, J Zuñiga, JdD Zornoza IFIC (CSIC - Universidad de Valencia)
OUTLINE || Harold Yepes || ANTARES Collaboration Meeting, 08-12 February 2010, CERN || • A REMINDER OF THE EXPERIMENTAL PROCEDURE • STATUS OF OPTICAL PROPERTY RUNS ACQUISITION • ANALYSIS BASED ON GOLDEN RUNS: NEW MEASUREMENTS PERFORMED WITH UV LEDS • CONCLUSIONS AND OUTLOOK
A REMINDER OF THE EXPERIMENTAL PROCEDURE F2 3 || Harold Yepes || ANTARES Collaboration Meeting, 08-12 February 2010, CERN || 1. THE EXPERIMENTAL SETUP: One single top LED of the lowest optical beacon in the line flashes to the upper storeys and the collected charge (Q) can be plotted and fitted through an exponential function for hits or charge, once quality cuts are applied. • The collected charge is a convolution of: • Physics: • Absorption length (Labs) • Scattering (Lsca and b = b(q)) • Detector: • OB – OM relative orientation • OM efficiency • ARS token ring dead time • Charge resolution • To minimize the effects of the detector: • Consider only OMs in the same line of the OB • Consider only the region (Rmin, Rmax) where signal < spe but well above background EXPONENTIAL FIT
A REMINDER OF THE EXPERIMENTAL PROCEDURE Qsignal Tmax NOISE LEVEL Tmin Qnoise 4 || Harold Yepes || ANTARES Collaboration Meeting, 08-12 February 2010, CERN || • 2. TIME DISTRIBUTION: • Determine the peak Gaussian fit • Choose a fixed time window [Tmin, Tmax] and select the hits: Tmin= Tpeak – 3s Tmax= Tpeak + 1000 ns • Calculate their overall charge Qtot and the signal hits. • 3. NOISE CONTRIBUTION: • Fit a constant in the [-1000, -50] ns range (Blevel) and substract the noise contribution (Qnoise): • Qsignal = Qtot – Qnoise = Qtot – Blevel (Tmin - Tmax) Time distribution
A REMINDER OF THE EXPERIMENTAL PROCEDURE 5 || Harold Yepes || ANTARES Collaboration Meeting, 08-12 February 2010, CERN || 5. PMT EFFICIENCY CORRECTION BY NOISE: • Assume that the Qnoise ~ ePMT • Normalize PMTs signal charge to their own noise charge: 4. CHARGE LOSSES: • Some hits are lost due to the electronic dead time from the readout of the ARSs. • Consider only the region where the probability to get more than one photoelectron is negligible (i.e. < 1 %). • Electronics dead time effects related to Rmin. Time distribution Efficiency correction by noise
A REMINDER OF THE EXPERIMENTAL PROCEDURE 6 || Harold Yepes || ANTARES Collaboration Meeting, 08-12 February 2010, CERN || 6. NOISE FLUCTUATIONS: • To avoid noise fluctuations at large distances, signal greater than the noise is required Maximum distance to fit Rmax. • 7. MEASUREMENT OF ERRORS: • Statistical and dispersion errors are considered for the data. • 8. LOW EFFICIENCY OMs CLEANING: • Low efficiency OMs are removed. Checked from noise plots Compute hits projections, fit a Gaussian and consider only OMs between (m+3s, m-3s). • 9. THE BACKGROUND “FLATNESS”: • Efficiency correction by noise is affected by noise fluctuations along the line A “flat” level noise along the line is required. • The experience from the analysis has let the optimization of • data taking: • Golden runs taken by request, once conditions are met. • No silver and copper runs taken anymore. • Updated golden runs table until 01/02/2010: GOLDEN RUN
STATUS OF OPTICAL PROPERTIES RUNS ACQUISITION 7 || Harold Yepes || ANTARES Collaboration Meeting, 08-12 February 2010, CERN || • DATA ACQUISITION STATUS: • Optical property runs are taken on request when background rates are low: • USER Line 1-12 LED Beacon - Optical properties HI - V3.1 (L2F2) • High intensity runs at 470 nm Stability in time of results is confirmed • USER Line 1-12 LED Beacon - Optical properties MI - V3.1 (L2F2) • Medium intensity runs for testing • USER Line 1-12 LED Beacon - L12 F2 KM3NeT LEDs - V3.1 (L12F2, UV!) • First UV runs obtained (11 UV runs at present) • USER Line 1-12 LED Beacon - only test (L4F2, L8F2, L2F9) • Different lines/OBs/LEDs (L4F2, L8F2) to study systematic effects and influence of depth on absorption length (L2F9).
ANALYSIS BASED ON GOLDEN RUNS 8 || Harold Yepes || ANTARES Collaboration Meeting, 08-12 February 2010, CERN || 1. THE STABILITY FOR THE OPTICAL PARAMETER L: Last Collaboration Meeting (Gandia): • Values for L obtained from different runs are stable provided that 1) a correction by efficiency is made (based on background rate), 2) high intensity runs are used and 3) phe level is required. • High intensity runs Rmin(H) = 135 m Rmax(H) = 275 m • Value for L computed from the number of hits if the reference fit (0F, 0F) is moved: • If Rmin decreases We go out from the photoelectron region L increases. • If Rmin increases Scattering effects are most remarkable L decreases. Reference fit
ANALYSIS BASED ON GOLDEN RUNS High intensity at 470 nm (blue) High intensity at 400 nm (UV) 9 || Harold Yepes || ANTARES Collaboration Meeting, 08-12 February 2010, CERN || 2. THE REFERENCE FIT FOR UV RUNS: • Take distances where the probability to get more than one phe is negligible: x = number of signal reaching the OM m = number of signal hits / number of flashes • High intensity runs (470 nm) Rmin(H) = 135 m Rmax(H) = 275 m • High intensity runs (400 nm) Rmin(H) = 135 m Rmax(H) = 275 m
ANALYSIS BASED ON GOLDEN RUNS 10 || Harold Yepes || ANTARES Collaboration Meeting, 08-12 February 2010, CERN || 3. RESULTS BY LED WAVELENGTH: L(470 nm) L8, L2, L4, L1 L(400 nm) L12
ANALYSIS BASED ON GOLDEN RUNS 11 || Harold Yepes || ANTARES Collaboration Meeting, 08-12 February 2010, CERN ||
ANALYSIS BASED ON GOLDEN RUNS 12 || Harold Yepes || ANTARES Collaboration Meeting, 08-12 February 2010, CERN || 4. RESULTS BY LINES: No hint of a dependence of L on line or OB
ANALYSIS BASED ON GOLDEN RUNS 13 || Harold Yepes || ANTARES Collaboration Meeting, 08-12 February 2010, CERN || 5. RELATIONSHIP BETWEEN L AND THE ABSORPTION LENGTH (labs): labs MC input L1000 IS A LOWER LIMIT FOR THE labs L obtained from Data L obtained from MC MC PRODUCTION Water model: Partic labs = 60 m fixed h = 0.17, 0.05 lscat = 30, 40, 50, 60, 70 m The difference labs - L depends on lscat and h ↔ b(q)
ANALYSIS BASED ON GOLDEN RUNS R R+ΔR ΔR ΔRcan be extracted from time distributions !!! Dt 14 || Harold Yepes || ANTARES Collaboration Meeting, 08-12 February 2010, CERN || 6. THE DR TECHNIQUE: • The effect of scattering is to increase the photon path length in ΔR on average. • Perform the exponential fit using (mean photon path), R + ΔR instead of R. • ΔR should be proportional to the scattering. • Exponential fit with R + ΔR will be more insensitive to scattering since the greater the scattering the greater the delay and viceversa, making the L parameter closer to the real • absorption length.
ANALYSIS BASED ON GOLDEN RUNS PRELIMINARY PRELIMINARY R +DR [m] R +DR [m] R [m] R [m] 15 || Harold Yepes || ANTARES Collaboration Meeting, 08-12 February 2010, CERN || 7. PARAMETERIZATION OF DR FOR DATA AND MC SIMULATIONS: Correlation between R+DR for MC Correlation between R+DR for data (golden runs) • The values of the above slopes are then related to the Rayleigh scattering (h). • MC simulations can give an idea about the scattering contribution, from the relationship between R + DR and R. R + DR = aR (a depends on scattering)
ANALYSIS BASED ON GOLDEN RUNS a PRELIMINARY lscat, eff 16 || Harold Yepes || ANTARES Collaboration Meeting, 08-12 February 2010, CERN || 8. DEPENDENCE OF h ON THE EFFECTIVE SCATTERING LENGTH (lscat, eff) Relationship lscat, eff and a (differents h) MC
ANALYSIS BASED ON GOLDEN RUNS PRELIMINARY PRELIMINARY 16 || Harold Yepes || ANTARES Collaboration Meeting, 08-12 February 2010, CERN || 9. RESULTS OF THE DR TECHNIQUE ON MC AND DATA: L parameter using DR parameterization DATA L parameter using DR parameterization MC • Fit of L to <R+DR> seems to “recover” labs • VERY PRELIMINARY Needs cross-checks !!!
CONCLUSIONS AND OUTLOOK || Harold Yepes || ANTARES Collaboration Meeting, 08-12 February 2010, CERN || • The new runs confirm the stability of Lfor high intensity runs in the blue (470 nm). • New UV (470 nm) runs have been taken. L (≈38 m)is also stable (good agreement with the old run of the previous L12F2 OB collaboration meeting Marseille). • L does not seem to depend on OB, LED or line. Depth dependence being currently studied. Systematic errors have to be revisited. • Monte Carlo simulations indicate that L is a lower limit of labs. However,D = labs L depends on lscat and on the angular distribution b(q) and these are poorly known (to say the least). An educated guess indicates D ≈ 5-10 m for 470 nm. • A first attempt has been made to extract information for lscat and b(q) from the time distribution at different distances. Assuming that scattering changes absorption length only through the increase of the effective travelled distance, the fit is made to R + ΔR (instead of R) where ΔR is extracted from data. Preliminary Monte Carlo results are encouraging (L is much closer tolabs), but still a lot of work to be done to check the range of applicability of the procedure. • Take new low intensity runs → distance OB-OM shorter → effect of lscat smaller→ L should approach labs . This is indeed roughly seen, but the few low intensity runs that we have are poorly understood, the exponential seems to change slope (an indication?). • Integration of new multi-wavelength OB in line 6 has taken place. Hopefully new data at different wavelengths soon.
BACKUP SLIDES || Harold Yepes || ANTARES Collaboration Meeting, 08-12 February 2010, CERN || THE BACKGROUND FLATNESS AS A QUALITY FACTOR Noise efficiency correction is affected by noise fluctuations along the line A “flat” level noise along the line is required. Golden RUN Copper RUN The background level flat shape along the line is correlated with low rates Special runs request at low mean background rates: E-LOG entry: 4126 USER Line 1-12 LED Beacon - Optical properties MI - V3.1 USER Line 1-12 LED Beacon - Optical properties HI - V3.1
BACKUP SLIDES || Harold Yepes || ANTARES Collaboration Meeting, 08-12 February 2010, CERN || DEPENDENCE OF P1 (a) ON SEVERAL WATER PARAMETERS
BACKUP SLIDES || Harold Yepes || ANTARES Collaboration Meeting, 08-12 February 2010, CERN ||
BACKUP SLIDES || Harold Yepes || ANTARES Collaboration Meeting, 08-12 February 2010, CERN ||
BACKUP SLIDES || Harold Yepes || ANTARES Collaboration Meeting, 08-12 February 2010, CERN ||
BACKUP SLIDES || Harold Yepes || ANTARES Collaboration Meeting, 08-12 February 2010, CERN ||
BACKUP SLIDES || Harold Yepes || ANTARES Collaboration Meeting, 08-12 February 2010, CERN ||
BACKUP SLIDES || Harold Yepes || ANTARES Collaboration Meeting, 08-12 February 2010, CERN ||