Download
1 / 25
250 likes | 381 Views
The AIDS Epidemic. Presented by Jay Wopperer. HIV/AIDS-- Public Enemy #1?. Intravenous Drug Use. Homosexual activity. Heterosexual activity. Blood Transfusions Work related fluid exchange contact, (i.e. doctors, nurses, etc..). What causes AIDS?. Statistic on AIDS.

E N D
The AIDS Epidemic Presented by Jay Wopperer
Intravenous Drug Use. Homosexual activity. Heterosexual activity. Blood Transfusions Work related fluid exchange contact, (i.e. doctors, nurses, etc..) What causes AIDS?
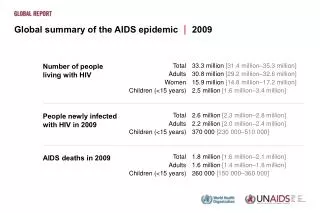
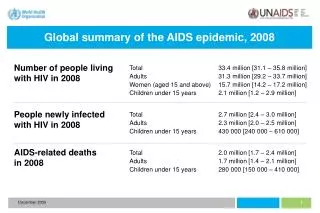
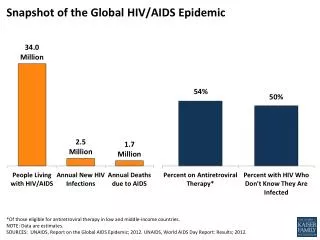
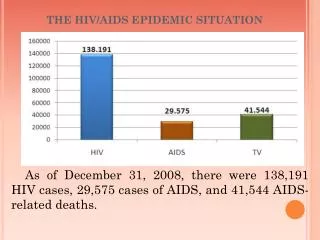
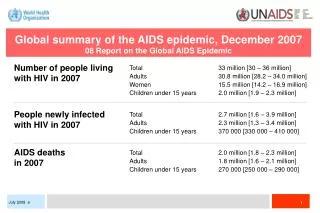
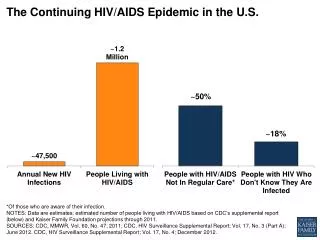
Statistic on AIDS • 40 million adults and 2.7 million children were living with HIV at the end of 2001. • 3 million people had died from AIDS or AIDS related diseases in 2001 • 1.2% of the overall world population has HIV or AIDS (8.6% in Africa, .6% in US) • In the US of the infected population 79% are men, 21% are women. • Average age range 30-34. • NYC has the most people suffering from AIDS (over 120,000).
HIV/AIDS -The Graphical Model HIV antibodies HIV/AIDS CD4 T-Cells
AIDS-- The Mathematical Model • We can think of AIDS as an S => I Model. In other words once one is infected, a person remains so until death. Where the contact rate depends on the population size:
What does our N’ model mean? As always N(t) = S(t) + I(t)
What does our S’ model mean? S is the number of people susceptible to AIDS N is our total population I is the number of people infected is our death rate, a is the birth rate
What does our I’ model mean? Disease carried death. Death rate for infectives so a measures the increase in the death rate attributed to disease. In other words we have the infected rate minus those that are going to die off.
Mean Life Span of an Infective • If there is no disease (I = 0), so N` = (a - m)N • Mean Life Span of an Infective (MLI) = • A single infective in an infinite population of susceptibles creates:
Analysis of R0: • If R0>1 • This implies that very few introduces infectives will grow by a factor of R0 every MLI period. • If this is our case, then the population, N, will dilute our infectives, I. In other words: I/N -> 0. • So our I class can be rejected, therefore populations grows exponentially. • In fact, it grows by a factor of:
Continued We can make the claim provided: Thus, we expect I/N to grow or decline by a factor: over an MLI period. Another important parameter combination is the number of offspring an infective has over its MLI:
Results • Case 1: R0 < 1 • Disease is weakly contagious or highly pathogenic. • N (t) => infinity, I (t) => 0 • Disease has no effect. • Case 2: R1 < 1 < R0 • N (t) => infinity, I (t) => infinity, but I (t) / N (t) => 0
Results (Continued) • Case 3: 1 < R1 • P0 > 1, P0 = 1 • P0 < 1 and R1 < • Disease contagiousness dominates both pathogenicity and host birth rate. • N (t) => infinity and I (t) => infinity. We see that N (t) grows exponentially but at a much slower rate than cases 1 and 2. • I (t) / N (t) =>
Results (Continued) • Case 4: P0 < 1 and R0 > • Disease is highly contagious but births from infectives are insufficient for exponential growth. • Here xe = ye = • The disease ‘stabilizes the population size and becomes endemic. • Results we obtained by papers written by H. Thieme, O Diekmann and M. Kretzschmar
Highly Contagious Diseases can “Control” a Population a = a-m Case 3 Case 4 a + a=bo bo= a +m Case 2 Case 1
Virus Dynamics • The effect of AIDS on CD4+ T cells • HIV ‘docks’ on the CD4 receptor of the T cells. • The new model is very similar to the SEIR model.
Steady States • We obtain two steady states for our model: Our trivial steady state. Our nontrivial steady state.
Analysis of Our Steady States To determine the stability of our steady states, we use the Jacobian matrix:
Our Trivial Steady State We evaluate our steady state at (T,0,0): We see the trace < 0 We see the det = If R0 < 1, det > 0 therefore stable If R0 > 1, det < 0 therefore unstable
Our Nontrivial Steady State We evaluate our steady state at Through this analysis it is difficult to determine stability.
Perilson Mathematician for claims the stability of our model will look like this S R0 S U
These models are all very new, some as recent as last year. Therefore AIDS research is still in its primitive stages. The complexity of AIDS makes it difficult to hone in on one specific problem, thus making it very difficult to model and predict. Conclusion