Download
1 / 24
260 likes | 403 Views
Improving Special Education Services December 2012. Results-Driven Accountability (RDA). New Initiative.

E N D
Improving Special Education Services December 2012 Results-Driven Accountability (RDA)
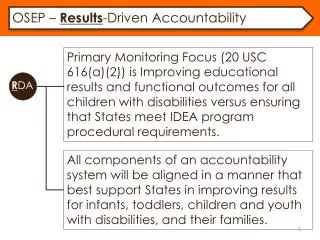
New Initiative • In March 2012, the Office of Special Education Programs (OSEP) announced that they would be taking steps to help close the achievement gap for students with disabilities by moving away from a one-size-fits-all, compliance-focused approach to a more balanced system that looks at how well students are being educated. • OSEP’s vision for the new Results-Driven Accountability (RDA) system is that all components of accountability will be aligned in a manner that best supports States in improving results for infants, toddlers, children and youth with disabilities, and their families.
Components of RDA • The major components of RDA will include: • (1) the State Performance Plan and Annual Performance Report (APR) and State Status Determinations (required under section 616 of the IDEA); and • (2) a differentiated system of monitoring and technical assistance (TA) that will support all States but especially those States with the most significant needs for improvement. • Performance of States relative to other States and to national data will be determined using data on priority elements, and will be used to determine the appropriate level of monitoring and technical assistance.
Special Education Accountability Structure The Office of Special Education Programs (OSEP) of the U.S. Department of Education establishes requirements for monitoring the effectiveness of service to students with disabilities (SWDs). States implement the monitoring process by reviewing the practices of local educational agencies
Shifting the Approach to LEA Monitoring Previously, OSEP’s monitoring requirements focused on whether LEAs were complying with federal laws when serving SWDs – often referred to as a “compliance model”. OSEP is now shifting the focus of its monitoring requirements toward determining whether services being provided to SWDs are effective in improving the educational outcomes for these students – often referred to as an “outcomes-based model”. OSEP has termed this approach “Results-Driven Accountability” (RDA).
Initial Research on RDA Implementation OSEP engaged the National Center on Educational Outcomes (NCEO) to identify measures of student performance that could be used in a RDA-based monitoring approach. The NCEO identified seven “framing considerations” to guide their work in identifying appropriate measures for inclusion.
Seven Framing Considerations Public transparency and understandability Multiple measures to ensure integrity of results 3. Incentive to states to implement with fidelity, not to “game the system” Ability to “flag” areas that need improvement 5. Include an improvement plan to validate current approach and evolve the system over time 6. Exclude variables that have inconsistent interpretations and reliability 7. Avoid increased burden on states by relying on current practices when possible and ensuring that measures are compatible with states’ current school accountability and improvement structures
NCEO Recommendations The NCEO developed a set of eight recommendations for Results-Driven Accountability based on their framing considerations: Report results of the various measures separately, rather than combining the various measures into a formula that produces a single result. This provides more transparency and creates fewer validity concerns.
NCEO Recommendations Provide data for reading and mathematics separately, as is done in state-developed accountability systems. This allows comparisons with NAEP results to determine the relative difficulty of state-based testing systems, and allows for better identification of each state’s strengths and needs. Include participation rates of SWDs in state assessments, including participation rates in alternative examination options.
NCEO Recommendations Include participation rates of SWDs on the state’s general assessment. This incentivizes states to maximize inclusion of SWDs on state assessments, a federal goal. Include performance of SWDs on the state’s general assessment, and the percentage of students determined to be “proficient and above.”
NCEO Recommendations Include the relative difficulty of the state’s general assessment. Given that state assessments and definitions of “proficiency” vary, adjusting for relative difficulty allows for comparison of outcomes across states. NCEO suggests using NAEP scores as a common measure against which individual states’ general assessments may be rated for difficulty.
NCEO Recommendations Include the gap in general assessment performance between students with disabilities and students without disabilities. This maintains focus on the goal of decreasing the achievement gap between these student groups. This measure should take into account whether the decrease in the gap is based on improved performance of SWDs, rather than decreased performance among students without disabilities.
NCEO Recommendations Include improvement in performance over time, when possible. If current systems do not allow for individual students, consider calculating changes in proficiency percentages of cohorts of SWDs across years, ideally at least two years apart (e.g., Proficiency percentages of students on IEPs in 2006-07 compared to proficiency percentages of such students in 2008-09.)
NCEO’s Proposed Reporting Format NCEO operationalized these recommendations by proposing a reporting format that consists of six tables. The first two tables would provide primary SWD performance information The other four tables would provide contextual information.
NCEO’s Proposed Reporting Format Table 1 – Reading Performance of SWDs on the General State Assessment Table 2 – Mathematics Performance of SWDs on the General State Assessment Table 3 – Reading and Math Overall Performance and State Targets Table 4 – Reading Alternative Assessments Table 5 – Mathematics Alternative Assessments Table 6 – Participation Rates for Students with Disabilities in Reading and Mathematics Assessments
National Assessment of Educational Progress (NAEP) assessments of reading and math are administered to a sample of students in each state in grades 4 and 8 every other year, and every four years in high school. Data from these assessments are not available at the district level. Input provided to the OSEP indicates that there are issues with using NAEP as a measure of performance for SWD, but it was also noted that the NAEP provides an important measure of the relative difficulty of state assessments
A review of the 2008-09 data for Reading Assessment indicates that the proficiency gap is as low as 19% and as high as 56.8%. 39 of the 51 states had gaps greater than 40% 37 states increase their percent proficient in Reading Assessment between 2006-07 and 2008-09. 17 states decreased their percent proficient over these same to years. In 2008-09, California’s ELA proficiency gap was 28%. California’s percent proficient in ELA increased from 16% in 2006-07 to 25% in 2008-09,
A review of the 2008-09 data for Math Assessment indicates that the proficiency gap is as low as 2.7% and as high as 54.7%. 36 of the 51 states had gaps greater than 40% 37 states increase their percent proficient in Math Assessment between 2006-07 and 2008-09. 18 states decreased their percent proficient over these same to years In 2008-09, California’s Math proficiency gap was 25% California’s percent proficient in Math increased from 21% in 2006-07 to 32% in 2008-09
More recently, grade level gaps in ELA ranged from 19% to 36%. The gaps continue to grow. Grade level gaps in Math ranged from 19% to 33%. Math gaps continue to grow as well
Of the states with data, 7 states met their SPP targets in ELA and 7 met their targets in Math. Only 4 of the 7 states are the same. Of the states with data, 25 did not meet their SPP targets in math or in ELA. 21 of the districts are the same.
These data indicate that students placed in regular class make up 54% of the overall population and 58% of the students who are proficient or advanced.
These data indicate that students placed in regular class make up 55% of the overall population and 64% of the students who are proficient or advanced.
Questions • If California is selected for review and assistance under the new RDA initiative: • What criteria and calculations should California use to select districts for review and assistance? • What needs do we have statewide to address gaps in performance between students with disabilities and their counterparts in general education?