Download
1 / 48
480 likes | 540 Views
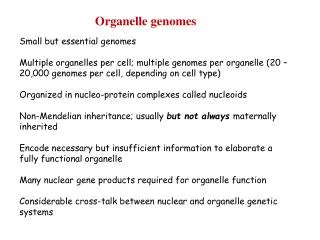
The Human Genomes. Gil McVean, Department of Statistics, Oxford. Genetic variation among humans. http://www.ncbi.nlm.nih.gov/genome/guide/human/. How do we differ? – Let me count the ways. Single nucleotide polymorphisms 1 every few hundred bp, mutation rate* ≈ 10 -9

E N D
The Human Genomes Gil McVean, Department of Statistics, Oxford
Genetic variation among humans http://www.ncbi.nlm.nih.gov/genome/guide/human/
How do we differ? – Let me count the ways • Single nucleotide polymorphisms • 1 every few hundred bp, mutation rate* ≈ 10-9 • Short indels (=insertion/deletion) • 1 every few kb, mutation rate v. variable • Microsatellite (STR) repeat number • 1 every few kb, mutation rate ≤10-3 • Minisatellites • 1 every few kb, mutation rate ≤ 10-1 • Repeated genes • rRNA, histones • Large inversions, deletions • Rare, e.g. Y chromosome TGCATTGCGTAGGC TGCATTCCGTAGGC TGCATT---TAGGC TGCATTCCGTAGGC TGCTCATCATCATCAGC TGCTCATCA------GC ≤100bp 1-5kb *per generation
Y chromosome variation • Non-pathological rearrangements of the AZFc region on the Y chromosome Tyler-Smith and McVean (2003)
Serological techniques for detecting variation Rabbit Human A B AB O A
Blood group systemLocus and chromosomal locationNumber of genesFunction of productNumber of allelesGene alterationsABOABO9q341Enzyme (glycosyltransferase)102Mutations*, insertions, deletions,gene rearrangementsChido-RodgersC4A, C4B6p21.32Complement factors7+Mutations, duplications, gene rearrangementsColtonAQP17p141Channel7Mutations, insertions, deletionsCromerDAF1q321Complement binding protein10MutationsDiegoSLC4A117q21-q22(erythroid & non-eryrhroid)1Anion exchanger;adhesion78Mutations*, insertions, deletionsDombrockDO12p12.31Not known9Mutations,one deletionDuffyFY1q22-q231Receptor9Mutations,one deletionGerbich (Ge)GYPC2q14-q211Cytoskeleton?9Mutations; gene rearrangementsGILAQP39p131Channel2Mutation splice siteH/h FUT1, FUT2# (+pseudogene)19q13.32Enzymes (glycosyltransferases)27 FUT1;22 FUT2Mutations*, insertions, deletions; one unequal homologous recombination.IGCNT2 (IGnT)6p241Enzyme (glycosyltransferase)7Mutations, exon delIndian(IN)CD4411p131Adhesion molecule2MutationsKell (with Kx blood group system))KEL7q33,XKXp212 (KEL, XK)KEL: enzymeXK: transporter?33 KEL; 30 XKMutations; deletions,insertion, gene deletions in XKKiddSLC14A118q12-q211Transporter8MutationsKnopsCR11q321Receptor24+(tentative, because of multiple mutations and gene rearrangements)Mutations*;deletions;duplicationsLandsteiner WienerICAM4 (LW)19p13.31Adhesion molecule3Mutation; one deletionLewisFUT3#(FUT6 #,FUT7 # also included;same family but do not result in a blood group phenotype19p1312Enzyme (glycosyltransferase)Enzymes (glycosyltransferases)1420MutationsMutations;one insertionLutheranLU19q13.2-13.31Adhesion molecule16MutationsMNSGYPA,GYPB,GYPE4q28-313 (GYPA,GYPB,GYPE)Not known43Unequal homologous recombinations*; gene conversions*; mutationsOKBSG19p13.31Factor; adhesion2MutationsP-related(includes P1 and globoside blood group systems)A4GALT;22q11.2-q13.2;B3GALT3;3q252Enzymes (glycosyltransferases)14 A4GALT;5 B3GALT;Mutations, insertions, deletionsRAPH-MER2CD15111p15.51Adhesion molecule3MutationsRhRHCE, RHD,1p34-36RHAG6p11-21.1RHBG#,RHCG#5Transporters116 RHCE, RHD;13 RHAGGene conversions, mutations, deletions for RHCE,RHD;recombinations for RHD; mutations for RHAGSciannaERMAP1p34.11Adhesion, receptor molecule?4MutationsXgXG, CD99 (MIC2)Xp22-332unknown;adhesion moleculeso far none documentedpolymorphism based on level of expression?YTACHE7q22.11Enzyme4Mutations; one deletion Blood group systems in humans • 28 known systems • 39 genes, 643 alleles http://www.bioc.aecom.yu.edu/bgmut/summary.htm
European Caucasoids African Blacks HLA diversity at the MHC locus 6p21.3 4 Mbp c. 127 genes DP DQ DR C4 C2 TNFa,b HLA-B HLA-C HLA-A HLA-D (18 genes) Class II Class III Class I HLA-A
Protein electrophoresis Starch or agar gel - + - - + + - - + - - - - - - + + - - - Direction of travel Lewontin and Hubby (1966) Harris (1966)
The rise of DNA sequence analysis • RFLPs • Cann et al 1987 • Sequencing of small regions • Vigilant et al 1991 • Whole genome sequencing • Ingman et al 2000
Different, but not that different • Humans are one of the least diverse organisms (excepting cheetahs) Photos from UN photo gallery www.un.org/av/photo
The biological significance of genetic variation • Genetic variation must underlie both pathological and non-pathological traits that show significant heritability • How do we locate these variants, and what use is finding them? • Genetic variation has been influenced by several million years of human existence. • How have human populations evolved over pre-historical times? • The distribution of variation is influenced by fundamental evolutionary processes • How has mutation, selection and recombination shaped the human genome?
Differences between autosomes, sex chromosomes, mtDNA • Under very simple models of populations, average pairwise differences is predicted by the formula • If m≈ 1.5x10⁻⁹ per site per generation, this implies that the human population is < 15,000 • Population geneticists refer to this number as the effective population size TISMWG (2001) Jobling, Hurles, Tyler-Smith (2004)
Demographic factors affecting diversity • Diversity is influenced by demographic factors such as • Variance in reproductive success • Differences in variance of success between males and females • Heritability of reproductive success • Changes in population size (growth, bottlenecks, natural fluctuations) • Which effects are most important? • Iceland: faster drift in matrilines due to shorter generation interval, but no differences between the sexes (Helgason et al 2003) • Quebec: heritability of reproductive success reduces diversity by more than an order in magnitude (Austerlitz and Heyer 1998) • The effective population size (Ne) is an approximation that allows simple mathematical models of populations to be applied to real data • Ne<< N
HLA Diversity is not randomly distributed across the genome Chromosome 6 TISMWG (2001)
Correlates and determinants of diversity • There is systematic variation in the mutation rate along chromosomes • Wolfe and Sharp (1987), Lercher et al (2001) • Levels of diversity correlate with recombination rates • Nachman et al (1998) • Diversity and the allele frequency spectrum of SNPs are influenced by the local GC content (above CpG frequency) • Eyre-Walker (1999), Smith and Eyre-Walker (2001) Lercher et al (2002) • Recombination rates are correlated (to some degree) with GC content • Eyre-Walker (1993), Fullerton et al (2001), Kong et al (2002) Lercher and Hurst 2002 Lercher et al (2001)
Diversity (p) Recombination rate (cM/Mb) What is the link between recombination and diversity? • A positive correlation between recombination rate and diversity could mean • Recombination is mutagenic • Diversity promotes recombination • Recombination and mutation are linked by a third factor (chromatin accessibility, transcription, Hill-Robertson effects) Mutation Hellmann et al 2003 Hitch-hiking
Diversity is not evenly distributed across genes I • Adaptive evolution ‘wipes out’ diversity nearby due to the hitch-hiking effects of a selective sweep • e.g. Duffy-null locus in sub-Saharn africa, protects against P. vivax • Hamblin and Di Rienzo (2000) FY*O mutation African Pop1 Pop2 European Ancestral allele Derived allele Missing data
Diversity is not evenly distributed across genes II • Purifying selection eliminates deleterious mutations and reduces diversity in regions of strong functional constraint Zhao et al (2003)
Diversity is not evenly distributed across genes III • Some genes are under balancing or diversifying selection, where diversity is actively selected for • MHC complex: heterozygote advantage and frequency-dependent selection driven by recognition of pathogens Horton et al (1998)
Diversity is not evenly distributed across populations I • African populations are more diverse than non-African populations • More polymorphisms • Polymorphisms at less skewed frequencies • Why? • Out-of-Africa event associated with a bottleneck? • Selection on genome in adaptation to novel habitats? Frisse et al (2001)
The Tajima D statistic • Measures departure from neutral coalescent expectations in allele frequency distribution • +ve values indicate excess of intermediate frequency variants • -ve values indicate excess of low-frequency variants • E.g. human mtDNA No. sites Observed Expected Rare allele frequency Data from Ingman et al (2000)
Diversity is not evenly distributed across populations II • Small, isolated populations often have skewed allele frequencies (+ve Tajima D) due to founder effects and high degree of genetic drift • Marginal populations (Evenki, Saami) • Island populations (Iceland, Sardinia) Finns Saami Swedes Evenki Minor allele frequencies at 50 SNPs (Kaessmann et al 2002)
The second dimension of human diversity! • The distribution of alleles at different loci are not independent • Correlations between SNPs are particularly strong for those <50kb • These correlations indicate shared evolutionary history Chromosomes Sites Chromosome 22: 1Mb 57 Europeans Lipoprotein Lipase: 10kb 48 African Americans Xq13: 10kb 69 worldwide
AB Ab AB Ab aB aB ab ab Correlations between SNPs are measured by linkage disequilibrium Linkage disequilibrium Linkage equilibrium
Why are SNPs correlated? . . . . . . . . . The mutation arises on a particular genetic background If the mutation increases in frequency by drift (or selection) the associated haplotype will also increase in frequency Over time the association between the new mutation and linked mutations will decay by recombination
What generates and destroys LD? • Genetic drift • Stochastic sampling process in finite population • Population structure and admixture • Correlations between mutations arising through shared population history • Natural selection • Combinations of favoured/unfavoured alleles (weak force) • Recombination is the ONLY force which breaks down LD • LD is a balance between recombination and other forces
Empirical patterns of LD • Large-scale surveys of LD in humans • e.g. Huttley et al. (1999), Abecasis et al. (2001), Reich et al. (2001) • LD extends over considerable distance (>>10kb) in most populations |D’| Kruglyak prediction 1 5 10 20 40 80 160 unlinked Distance (kb) Reich et al. (2001)
Differences between populations • African populations show less LD than European populations (e.g. Frisse et al. 2001) • Small, isolated populations (e.g. Saami, Evenki) show increased LD (Kaessmann et al 2002) • Founder populations (e.g. Finland, Sardinia) do not always show increased LD (e.g. Eaves et al. 2000) r2
Assessing the contribution of structure to LD • Rosenberg et al. (2002) • Population differences in allele frequency exist, but many markers/loci are required in order to estimate ethnic origin with accuracy • Admixture between populations has played an important historical role Oceania Europe Middle east Asia America Africa
Differences between genomic regions • Evidence for heterogeneity in LD along/between chromosomes • Taillon-Miller et al (2000), Jeffreys et al (2001), Daly et al (2001), Patil et al (2001), Reich et al (2001), Reich et al (2002), Gabriel et al (2002), Dawson et al (2002), Phillips et al (2002) Average |D’| Dawson et al (2002) Reich et al (2001)
Differences within genomic regions Jeffreys et al (2001)
Recombination hot-spots in the MHC region • Other genes with recombination hot-spots • B-globin • PAR/SHOX • MS32 • (Chi sequences) Jeffreys et al (2001)
In an ideal block world... • Blocks extend many (>100) kbs. • All alleles within blocks are in strong associations. • There are no associations between blocks. • In each block, only a few (4-5) haplotypes account for the majority (>90%) of variation. • In each block, only a few SNPs are required to map the majority of haplotype variation. • Blocks correspond to recombination hot-spots. Pääbo (2003) “Association studies suddenly look much less difficult...” Goldstein (2001)
The international Hapmap project • International partnership of scientists and funding agencies from Canada, China, Japan, Nigeria, the United Kingdom and the United States to develop a public resource that will help researchers find genes associated with human disease and response to pharmaceuticals • Gibbs et al (2003) • Aims to survey variation across entire human genome at 1 SNP per 5kb or less, in three populations (CEPH Europeans, Chinese/Japanese, Yoruban Africans). More than 600,000 SNPs with MAF>5% • http://www.hapmap.org/ • All data is public access and available through the Data Coordination Center (DCC)
How are blocks defined? • Incompatibility through the four-gamete test • Wang et al. (2002) • Regions with consistently high pairwise LD measures • Gabriel et al. (2002) • Dynamic programming solutions based on • Measures of pairwise LD structure - Zhang et al. (2002) • Minimum description length (information theoretic principles) – Koivisto et al. (2002), Anderson et al (2003)
Empirical block pattern Blocks Length % match frequencies Daly et al (2001)
Patil et al [E(block) = 13.3 kb] Dawson et al. [E(block) = 38 kb] Gabriel et al. [E(block) = 22 kb] Problems with blocks • Block definitions depend on marker spacing, allele frequency and algorithm. • Blocks (as defined by some algorithms) may not reflect variation in the recombination rate All reported mean block lengths consistent with uniform recombination (+ 1 SD) Phillips et al (2003)
Do we need haplotype blocks? • The key determinant of LD is recombination • True haplotype blocks are formed by regions of low recombination separated by recombination hotspots • If we knew the fine-scale (<<Mb) structure of recombination-rate variation, blocks would not be necessary • Genetic maps estimated from pedigree studies show recombination rate variation • BUT do not have the resolution to define recombination hotspots Chromosome 3 Kong et al (2000)
Learning about recombination from diversity • We can estimate the fine-scale structure of recombination rates from patterns of genetic variation Rate estimates from sperm (Jeffreys etal 2001) Genes n=50 unrelated European genotypes
Comparison with pedigree-based maps • Summing fine-scale estimates over 2Mb intervals accurately recovers variation in recombination rate detected by pedigree studies Chromosome 22 Chromosome 19 Markers for pedigree-based map Sex-averaged recombination rate (cM/Mb) Position (kb) Position (kb) PedigreePopulation genetic
Population genetic estimate of rates 2.5 - 97.5 percentiles of sampling distribution deCODE rates for region NCOA3 Genes on forward and reverse strands A chromosomal view of recombination rate variation • 10Mb of Chromosome 20, 96 CEPH genotypes, 4337 SNPs Sex-averaged recombination rate (cM/Mb) Position
What is the probability that there exists a SNP in this region that is NOT in LD with currently observed SNPs? ?
SNP in LD SNP not in LD?
The answer depends on recombination Recombination rate If recombination is high, the untyped SNP is unlikely to be in association
If recombination is low, the untyped SNP is likely to be in association Recombination rate We can use population genetic methods to estimate the recombination rate and predict the distribution of the untyped SNP
Hapmap challenges • Prediction • Do the SNPs currently genotyped provide an accurate representation of variation at linked SNPs in other samples from the same population? • Selection of tagging SNPs • What is the smallest number of SNPs I need type in order to achieve a given level of power? • Demography • Are the results from one population transferable to other populations?
Suggested reading • Jobling MA, Hurles ME and Tyler-Smith C. 2004. Human Evolutionary Genetics: Origins, Peoples & Disease. Garland Science • Balding DJ, Bishop M and Cannings C. 2001. Handbook of Statistical Genetics. John Wiley and Sons Ltd. • Li W-H. 2001. Molecular evolution. Sinauer.
References 1. E. C. Anderson and J. Novembre, Am.J.Hum.Genet.73, 336-354 (2003). 2. F. Austerlitz and E. Heyer, Proc.Natl.Acad.Sci.U.S.A95, 15140-15144 (1998). 3. R. L. Cann, M. Stoneking, A. C. Wilson, Nature325, 31-36 (1987). 4. M. J. Daly, J. D. Rioux, S. F. Schaffner, T. J. Hudson, E. S. Lander, Nat.Genet.29, 229-232 (2001). 5. E. Dawson et al., Nature418, 544-548 (2002). 6. I. A. Eaves et al., Nat.Genet.25, 320-323 (2000). 7. A. Eyre-Walker, Proc.R.Soc.Lond B Biol.Sci.252, 237-243 (1993). 8. A. Eyre-Walker, Genetics152, 675-683 (1999). 9. L. Frisse et al., Am.J.Hum.Genet.69, 831-843 (2001). 10. S. M. Fullerton, C. A. Bernardo, A. G. Clark, Mol.Biol.Evol.18, 1139-1142 (2001). 11. S. B. Gabriel et al., Science296, 2225-2229 (2002). 12. R. A. Gibbs et al., Nature426, 789-796 (2003). 13. D. B. Goldstein, Nat.Genet.29, 109-111 (2001). 14. M. T. Hamblin and A. Di Rienzo, Am.J.Hum.Genet.66, 1669-1679 (2000). 15. A. Helgason, B. Hrafnkelsson, J. R. Gulcher, R. Ward, K. Stefansson, Am.J.Hum.Genet.72, 1370-1388 (2003). 16. I. Hellmann, I. Ebersberger, S. E. Ptak, S. Paabo, M. Przeworski, Am.J.Hum.Genet.72, 1527-1535 (2003). 17. R. Horton et al., J.Mol.Biol.282, 71-97 (1998). 18. M. Ingman, H. Kaessmann, S. Paabo, U. Gyllensten, Nature408, 708-713 (2000). 19. A. J. Jeffreys, L. Kauppi, R. Neumann, Nat.Genet.29, 217-222 (2001). 20. M. A. Jobling, M. E. Hurles, C. Tyler-Smith, Human Evolutionary Genetics: Origins, Peoples & Disease (Garland Science, New York, 2004). 21. H. Kaessmann et al., Am.J.Hum.Genet.70, 673-685 (2002). 22. M. Koivisto et al., Pac.Symp.Biocomput. 502-513 (2003). 23. A. Kong et al., Nat.Genet.31, 241-247 (2002). 24. M. J. Lercher and L. D. Hurst, Trends Genet.18, 337-340 (2002). 25. M. J. Lercher, N. G. Smith, A. Eyre-Walker, L. D. Hurst, Genetics162, 1805-1810 (2002). 26. M. J. Lercher, E. J. Williams, L. D. Hurst, Mol.Biol.Evol.18, 2032-2039 (2001). 27. M. W. Nachman, V. L. Bauer, S. L. Crowell, C. F. Aquadro, Genetics150, 1133-1141 (1998). 28. S. Paabo, Nature421, 409-412 (2003). 29. N. Patil et al., Science294, 1719-1723 (2001). 30. M. S. Phillips et al., Nat.Genet.33, 382-387 (2003). 31. D. E. Reich et al., Nature411, 199-204 (2001). 32. D. E. Reich et al., Nat.Genet.32, 135-142 (2002). 33. N. A. Rosenberg et al., Science298, 2381-2385 (2002). 34. R. Sachidanandam et al., Nature409, 928-933 (2001). 35. N. G. Smith and A. Eyre-Walker, Mol.Biol.Evol.18, 982-986 (2001). 36. P. Taillon-Miller et al., Nat.Genet.25, 324-328 (2000). 37. C. Tyler-Smith and G. McVean, Nat.Genet.35, 201-202 (2003). 38. L. Vigilant, M. Stoneking, H. Harpending, K. Hawkes, A. C. Wilson, Science253, 1503-1507 (1991). 39. N. Wang, J. M. Akey, K. Zhang, R. Chakraborty, L. Jin, Am.J.Hum.Genet.71, 1227-1234 (2002). 40. K. Zhang, M. Deng, T. Chen, M. S. Waterman, F. Sun, Proc.Natl.Acad.Sci.U.S.A99, 7335-7339 (2002). 41. Z. Zhao, Y. X. Fu, D. Hewett-Emmett, E. Boerwinkle, Gene312, 207-213 (2003).