Download
1 / 23
250 likes | 463 Views
Phillips Curve and Stabilization Policy. Activity 46 by Joanne Benjamin Los Gatos High School, Los Gatos, CA Advanced Placement Economics Teacher Resource Manual . National Council on Economic Education, New York, N.Y. Objectives. Define the Phillips curve

E N D
Phillips Curve and Stabilization Policy Activity 46 by Joanne Benjamin Los Gatos High School, Los Gatos, CA Advanced Placement Economics Teacher Resource Manual. National Council on Economic Education, New York, N.Y.
Objectives • Define the Phillips curve • Demonstrate short-run trade-off between unemployment and inflation. • Show how monetary and fiscal policy can help the economy move along the short-run Phillips curve. • Show how the short-run Phillips curve becomes a vertical long-run Phillips curve.
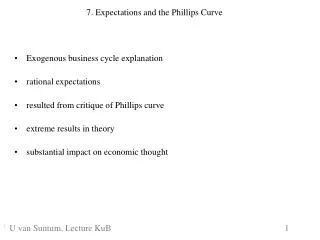
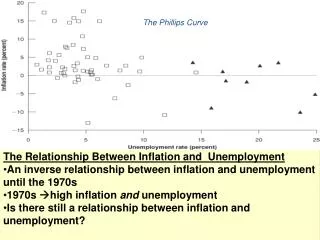
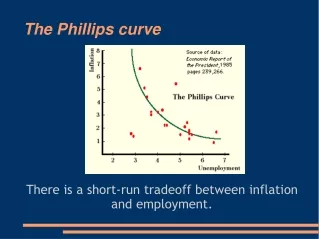
Introduction • The Phillips Curve is an empirical relationship founded by A.W. Phillips that shows the relationship between the unemployment rate and the rate at which wages change. • He discovered that changes in wages were inversely related to the unemployment rate. Subsequent research established the same relationship between inflation and unemployment.
Introduction • During the 1960’s, many economists and policy makers thought there was a consistent trade-off between price changes and unemployment. • However, the trade-off is a short-run phenomenon, and inflationary expectations can shift the short-run Phillips curve. • The long-run Phillips curve is a vertical line at the long-run aggregate supply curve.
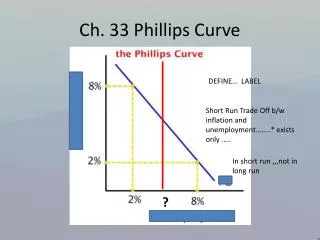
The Short-Run Phillips Curve (SRPC) shows the relationship between inflation and unemployment, holding the expected inflation rate and the natural rate of unemployment constant. • Remember that the natural rate of unemployment is the rate of unemployment at full-employment output. • Point A on the curve is the expected inflation rate-natural unemployment rate point. • If there is an unanticipated increase in aggregate demand, then unemployment decreases and inflation increases: a movement up the curve towards point A2 Inflation Rate (%) A2 • A Pe • A3 • SRPC UN Unemployment Rate (%)
AD and SRAS and Short-Run Phillips Curve • The Phillips curve relationship can be explained using the aggregate demand and aggregate supply model. • Suppose that aggregate demand and aggregate supply intersect at full employment. • Suppose that aggregate demand is expected to increase.
The AD curve shifts to AD1. The money wage rate will rise because of the anticipated increase in prices: • People want to maintain their real wage. • The increase in the nominal wage rate shifts the SRAS to SRAS1, and we are at Point A in both the Phillips curve graph and the SRAS graph Price Level LRAS Inflation Rate (%) SRAS1 SRAS A A Pe • AD2 SRPC AD1 UN Real GDP Unemployment Rate (%)
Now let’s suppose that aggregate demand increases again. People thought AD would move to AD1 but instead it increases to AD2. • The economy moves to Point A2 in both graphs. • Unemployment is below the natural rate, and inflation is above the expected rate of inflation. • If policy makers attempt to keep the unemployment rate at the level associated with A2, people will come to expect the inflation rate associated with A2. • As a result, the SRPC will shift upward and/or outward until the inflation rate associated with A2 is at the natural rate of unemployment. Inflation Rate (%) Price Level LRAS SRAS1 SRAS A2 A2 • A A AD3 Pe • AD2 SRPC AD1 UN Real GDP Unemployment Rate (%)
But in reality AD does not increase. The economy moves to a point like A3 in both figures. • What will happen if people expect the AD curve to increase and adjust their wages accordingly? Inflation Rate (%) Price Level LRAS SRAS1 SRAS A2 A2 • A A AD3 Pe • A3 A3 AD2 • SRPC AD1 UN Real GDP Unemployment Rate (%)
Summary • The SRPC was drawn to give an expected rate of inflation and a specific natural rate of unemployment. • The SRPC will shift up if the expected inflation rate increases, as occurred in the 1970’s. • The SRPC will shift leftward if the natural rate of unemployment decreases.
Activity 46: Short-Run PC • Suppose government policy makers want to increase GDP because the economy is not operating at its potential. They can increase aggregate demand by increasing government spending, lowering taxes or a combination of both. Using an AD and SRAS model, draw a new AD curve that will represent the change caused by government policy designed to increase real GDP.
Price Level SRAS p2 • What happens to the price level in the short run? _____________ • What happens to real GDP in the short run? _______________ • What happens to the rate of unemployment in the short run? ________________ (Remember the examples!) • The Federal Reserve can use monetary policy to try to stimulate the economy. It can encourage bank lending by _______________ bonds on the open market, _____________ the discount rate, and/or ______________ the reserve requirements. (We will be studying this further in chapters to come.) p1 AD1 AD Real GDP Yp Y1 Increases Increases decreases purchase decreasing decreasing
A Phillips curve would tell the same story. Inflation is low at high levels of unemployment, but inflation begins to increase as the unemployment rate decreases. • The Phillips curve is useful for analyzing short-run movements of unemployment and inflation. (See figure 46.3)
Activity 46: Short-Run PC 2. Aggregate supply shocks resulting from the oil embargo imposed by Middle Eastern countries (OPEC) and worldwide crop failures helped to bring about higher inflation and higher unemployment rates. The economy, with rising prices and decreased output, was in a state of stagflation. Using an AD and SRAS model, draw a new SRAS curve that will represent the change caused by the OPEC oil embargo.
In the late 1960s, some economist such as Milton Friedman and Edmund Phelps published papers that concluded there were two Phillips curves; one for the short-run and one for the long-run. The controversy continued as the economy of the 1970s experienced high inflation and high unemployment at the same time. The relationship appeared to be less stable than previously thought; the short-run Phillips curve had shifted to the right. Inflation Rate (%) 1970s SRPC 1960s SRPC Unemployment Rate (%)
LRAS Price Level SRAS1 SRAS • In the short run, based on the SRAS. (i) what happens to the price level? ____________ (ii) what happens to real GDP? ____________ (iii) what happens to the rate of unemployment? ____________ p2 p1 AD Real GDP Y1 Yp Increases Decreases Increases
The wage rate will decline in response to the increased unemployment rate. (B) As the economy moves to the long run, (i) What happens to the wage rate? (ii) What happens to the price level? (iii) What happens to real GDP? (iv) What happens to the rate of unemployment? The price level will return to the original level. As the wage rate declines, the SRAS shifts back toward the original SRAS. The output level will eventually return to its original level. The rate of unemployment will decline initially, then return to the original level of unemployment.
3. Use the AD and SRAS model in Fig.46.6 to show the appropriate response to the oil-price increases in the following instances. Be sure to show on the graph the effects of he oil price increase. (A) If unemployment were the main concern of policy makers. (B) If inflation were the main concern of policy makers. (C) If inflation and unemployment were of equal concern.
Figure 46.6 Policy Response to Oil Embargo LRAS Price Level SRAS1 SRAS p3 • The increase in oil prices shifts the SRAS from SRAS to SRAS1. p2 AD1 p1 AD Real GDP Y1 Yp (A) If unemployment is the concern of policy makers, they will increase AD from AD to AD1 using expansionary monetary and fiscal policy. (B) If inflation is the concern, policy makers will probably maintain current policies and allow the self-correcting forces in the economy to move he economy back to the original price level and output. (C) If inflation and unemployment are equally important, the authorities will carry out some expansionary policies but not to shift the aggregate demand as fast as AD1.
As inflation in the 1970s continued to increase, economists argued that, for a reduction in money growth to be fully effective in lowering inflation, the Federal Reserve would need to convince people it was serious about reducing money growth—in other words, the Fed would stick with a lower money growth policy until inflation decreased. Why would it be important for the Fed to establish this credibility? If the public doesn’t believe the Fed intends to maintain a low growth rate in the money supply, the public will simply demand higher wages, assuming the fed will not be willing to live with a higher unemployment rate. The public expects continued inflation. The Fed would want to establish its credibility to reduce inflationary expectations and thus reduce wage demands.
In 1980, the unemployment rate was no lower than it had been in 1960, but inflation was much higher. Between 1980 and 1982, the economy experienced a recession and unemployment rose. Explain the general effect of a recession on unemployment and inflation. Then explain why the recession of 1980-82 was accompanied by high inflation. In general, if there are no policy changes, a recession will reduce inflation by decreasing the inflationary pressure of wage increases. During this period, the Fed did not accommodate the oil-price shocks and the economy sustained a high unemployment rate in conjunction with high inflation. This period lasted until the public believed that the Federal Reserve would not increase money growth to reduce unemployment. The public changed its inflationary expectations.
6. Eventually the OPEC cartel was weakened, and energy prices decreased. Several U.S. industries, including communications and transportation, were deregulated. This caused greater competition. Explain and illustrate the effects of a weakened oil cartel and deregulation using both the aggregate demand and aggregate supply model and the Phillips curve.
A weakened oil cartel decreased energy prices and therefore production costs. Deregulation allows for greater competition, resulting in lower production costs and product prices. The short-run aggregate supply curve shifts to the right, and the SRPC shifts to the left. Inflation Rate (%) Price Level LRAS SRAS SRAS1 p p1 SRPC AD SRPC1 Y Y1 Real GDP Unemployment Rate (%)