Download
1 / 11
110 likes | 278 Views
Performance Matrix. Balances a wide range of objectives including program results (kw, kwh), portfolio results, benefit, net benefit, market effects, activity milestones, etc. Provides a mechanism to make necessary tradeoffs between multiple and diverse C

E N D
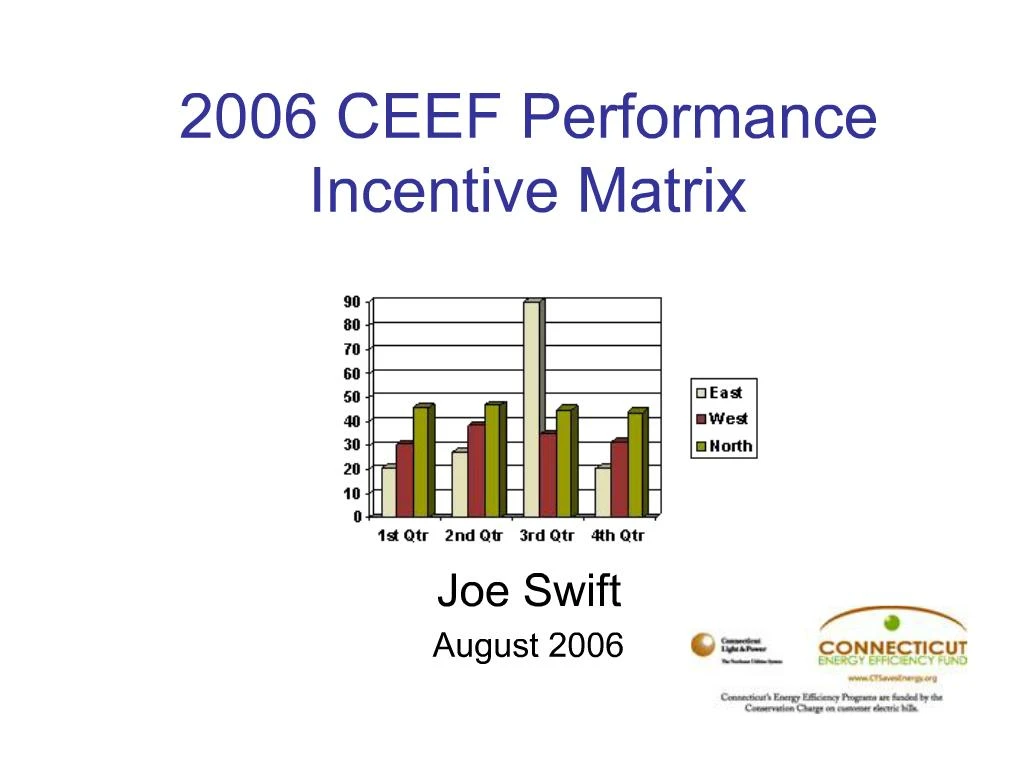
1. 2006 CEEF Performance Incentive Matrix Joe Swift
August 2006
2. Performance Matrix Balances a wide range of objectives including program results (kw, kwh), portfolio results, benefit, net benefit, market effects, activity milestones, etc.
Provides a mechanism to make necessary tradeoffs between multiple and diverse C&LM Policy objectives.
Measurable and verifiable.
6. Note the following:
Based on planning numbers/table B.
Residential is 42.5%. C&I is 57.5%.
EB (electric benefit) and NEB (net electric benefit) make up 88% of the performance incentive
Some measures/activities roll up into several categories (i.e. E-Star Homes) and will have a �ripple effect� on the overall KPI.
Balance mechanism � can�t put all your eggs in one basket!
7. Electric Benefit (EB) Electric Benefit is the net present value ($ dollars) of the energy saved (kWh) and capacity (kW).
Residential Measures �
EB = $0.05630 x Life kWh + $1,183.69 x Annual kW.
C&I Measures �
EB = $0.05031 x Life kWh + $1,803.71 x Annual kW.
Exhibit 4 of the 2006 filing.
8. Net Electric Benefit (NEB) Net Electric Benefit is the Electric Benefit
9. Net Electric Benefit A Light bulbs costs $8. Savings is 40 kWh for 6 years and kW reduction is 0.003
EB = 40 kwh x 6 years x $0.05630 + $1,183.69 x 0.0055 kw =
= $20.02 ($20).
NEB = $20.00 - $8.00 = $12.00
B/C Ratio = Electric Benefit/Cost = $20/$8 = 2.5
10. Scoring Points (EB) and Winning the Game (NEB)
11. . .
12. Summary Motivates Portfolio Managers to use skills and ingenuity to obtain greatest possible yield.
Maximize benefit AND minimize cost (increases b/c ratio of portfolio)
Designed to achieve various diverse objectives and provide a balanced portfolio.
Allows flexibility and trade offs, and prevents gaming.