Download

1 / 22
220 likes | 224 Views
This study aims to predict 2010 daughter data using 2006 predicted transmitting abilities (PTAs) or genomic PTAs, with the inclusion of validation results and gains in R2. The analysis includes statistics from Jorjani's 2010 Interbull Genomics Workshop, and data from various countries such as DEU, FRA, NLD, DFS, JPN, POL, NZL, and CAN. The study also explores the benefits of selective genotyping in reducing regressions and the use of genotyped versus non-genotyped bulls. The top young and proven bulls in 2006 and the most genotyped progeny as of January 2010 are included in the analysis.

E N D
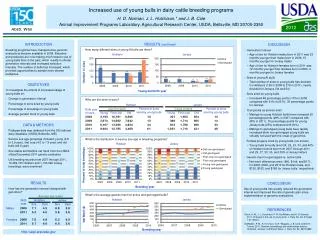
Genomic Validation Tests • Predict 2010 daughter data using 2006 PA or genomic PTA • DYD2010 = apa + bpa PA2006 + e • DYD2010 = apta + bpta PTA2006 + e • Statistics from Jorjani, 2010 Interbull Genomics Workshop • Foreign average includes DEU, FRA, NLD, DFS, JPN, POL, NZL, and CAN • FRA not latest data (10,000 bulls)
Regressions and Gains in R2When predicting last 4 years of data
Validation Results • EuroGenomics reliabilities about 5% higher than in North America • 10% REL gain from exchange • Similar regressions, slightly < 1.0 • Validation expects regressions < 1 with selective genotyping of bulls • Means of genotyped vs. nongenotyped • Most countries genotyped all recent bulls
Best Young, Proven Bulls in 2006 • Ranked by 2006 Net Merit • Computed from August 2006 data • Cow adjustments not included • Genomic PTAs on ftp since Nov 2009: • ftp://aipl.arsusda.gov/pub/outgoing/validation0608.zip • Base adjusted using: (NM$ – 132) * 1.13 • Top 7 young, old bulls in each stud • At least 70% reliability for traditional NM • Studs 29, 14, 11, 7, 1 • Young now average $495, old average $360