Download
1 / 6
60 likes | 65 Views
:: Slide 1 ::. :: Slide 2 ::. What Is Science? How Do Psychologists Conduct Research? How Do We Study the Effects of Time? How Do We Draw Conclusions From Data? How Can We Conduct Ethical Research?

E N D
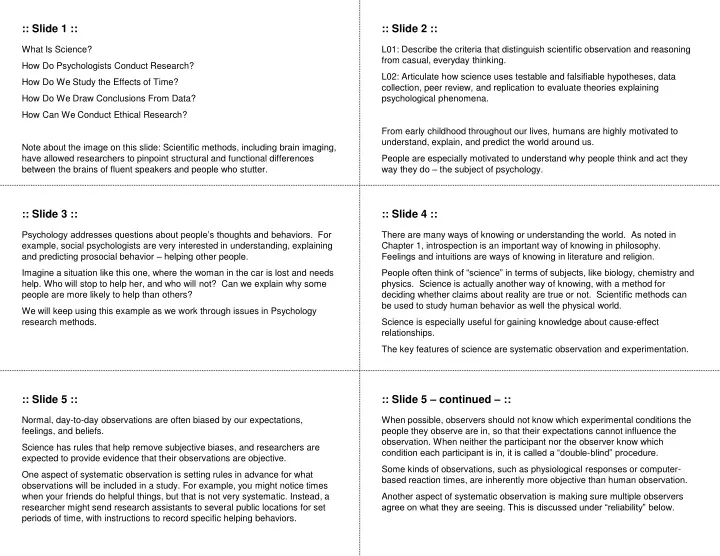
:: Slide 1 :: :: Slide 2 :: What Is Science? How Do Psychologists Conduct Research? How Do We Study the Effects of Time? How Do We Draw Conclusions From Data? How Can We Conduct Ethical Research? Note about the image on this slide: Scientific methods, including brain imaging, have allowed researchers to pinpoint structural and functional differences between the brains of fluent speakers and people who stutter. L01: Describe the criteria that distinguish scientific observation and reasoning from casual, everyday thinking. L02: Articulate how science uses testable and falsifiable hypotheses, data collection, peer review, and replication to evaluate theories explaining psychological phenomena. From early childhood throughout our lives, humans are highly motivated to understand, explain, and predict the world around us. People are especially motivated to understand why people think and act they way they do – the subject of psychology. :: Slide 3 :: :: Slide 4 :: Psychology addresses questions about people’s thoughts and behaviors. For example, social psychologists are very interested in understanding, explaining and predicting prosocial behavior – helping other people. Imagine a situation like this one, where the woman in the car is lost and needs help. Who will stop to help her, and who will not? Can we explain why some people are more likely to help than others? We will keep using this example as we work through issues in Psychology research methods. There are many ways of knowing or understanding the world. As noted in Chapter 1, introspection is an important way of knowing in philosophy. Feelings and intuitions are ways of knowing in literature and religion. People often think of “science” in terms of subjects, like biology, chemistry and physics. Science is actually another way of knowing, with a method for deciding whether claims about reality are true or not. Scientific methods can be used to study human behavior as well the physical world. Science is especially useful for gaining knowledge about cause-effect relationships. The key features of science are systematic observation and experimentation. :: Slide 5 :: :: Slide 5 – continued – :: Normal, day-to-day observations are often biased by our expectations, feelings, and beliefs. Science has rules that help remove subjective biases, and researchers are expected to provide evidence that their observations are objective. One aspect of systematic observation is setting rules in advance for what observations will be included in a study. For example, you might notice times when your friends do helpful things, but that is not very systematic. Instead, a researcher might send research assistants to several public locations for set periods of time, with instructions to record specific helping behaviors. When possible, observers should not know which experimental conditions the people they observe are in, so that their expectations cannot influence the observation. When neither the participant nor the observer know which condition each participant is in, it is called a “double-blind” procedure. Some kinds of observations, such as physiological responses or computer-based reaction times, are inherently more objective than human observation. Another aspect of systematic observation is making sure multiple observers agree on what they are seeing. This is discussed under “reliability” below.
:: Slide 6 :: :: Slide 6 – continued – :: As we shall see shortly, the term “experiment” has a specific meaning in science. In a more general sense, though, experimentation refers to the process of generating a testable hypothesis based on your theory, and then collecting systematic observations, or “data,” to see whether the hypothesis is supported. The process of science begins with a theory – a proposed set of facts and relationships between facts that explain and predict observed phenomena. In Psychology, theories often propose cause-effect relationships that explain people’s behavior. (Students brainstorm variables predicting helping.) The theory is used to generate a hypothesis – an “if-then” statement about what should happen in a specific research scenario if the theory is true. Good hypotheses are: (1) falsifiable, which means it is possible for systematic observations to disconfirm the hypothesis, and (2) testable, which means that the hypothesis can be evaluated using currently available research methods. (Students brainstorm hypotheses suggested by their theories of helping.) Once you have a hypothesis, you can collect systematic observations, a.k.a. “data,” and see whether the data are consistent with the hypothesis or not. If so, the theory is supported. If not, the theory must be modified or discarded. :: Slide 7 :: :: Slide 8 :: It’s not enough for scientists to collect data. Other procedures are in place to help ensure that the knowledge generated by science can be trusted. Before a study can be published it is subjected to peer review. The study report is sent to other scientists who comment on its strengths and weaknesses. If reviewers find problems with the methods, or feel conclusions are not justified based on the data, they may recommend against publication. Once a study is published, other researchers may try to replicate or re-create it to see if they get the same results. If the theory is correct other researchers should get roughly the same results if they do the same study. The researchers John Darley and Dan Batson tested three separate theories of helping in a classic study of prosocial behavior. The 3 theories were: (1) People who are thinking about the moral injunction to help others will be more helpful; (2) People who are more religious are more helpful; and (3) People who are under time pressure will be less helpful. :: Slide 9 :: :: Slide 10 :: Darley and Batson designed a study to test all three theories at once. Participants were 40 male students at a seminary. Before the testing session, participants filled out questionnaire measures of religiosity. At the testing session, each participant was instructed to prepare a talk to give in another building: the talk was either on the parable of the “Good Samaritan,” or on jobs for seminary students. He was give one of three instructions about time pressure: that he was early and there was plenty of time, that he was just on time, or that he was late and would have to hurry. On the way to give the talk, each participant passed a man slumped in a doorway, coughing and groaning. The 3 hypotheses were: (1) Participants planning a speech on the Good Samaritan will be more helpful than those planning a speech on jobs for seminary students; (2) People who score higher on various aspects of religiosity will more helpful than those with lower scores; and (3) People who have plenty of time will help more than those in a hurry.
:: Slide 11 :: :: Slide 12 :: The “victim” coded whether each participant tried to help him, and if so, how. After a first offer, the victim said he just needed to take a pill and rest. Data supported one hypothesis, but not the others. Helping did not depend upon which topic the participant was planning to speak on. This suggests that salience of norms for helping does NOT actually make people more helpful. Helping also was not predicted by religiosity. None of the religiosity scales used in the study was associated with higher amounts of helping However, time pressure DID affect helping. Those who were told they had plenty of time offered more help than those told they had to hurry. :: Slide 13 :: :: Slide 14 :: LO3: Explain the main goal of descriptive research methods and the ways in which case studies, naturalistic observations, and surveys approach this goal. LO4: Differentiate the key features, strengths, and limitations of correlational and experimental methods, and apply this distinction in designing a new study or interpreting the results of a study. The process of science is used to link systematic observations to our theories about human behavior. Methods for collecting observations fall into three main categories: descriptive, correlational, and experimental methods. Each has strengths and limitations, and is useful in different situations. Descriptive methods are used when researchers are still developing their theories. Observations in descriptive studies may not test a specific hypothesis, but instead be used to build preliminary evidence. Case studies are in-depth examinations of one person or a small number of unusual people. For instance “H.M.,” a patient with amnesia resulting from brain surgery, was studied intensively for more than 50 years. :: Slide 14 – continued – :: :: Slide 15 :: Naturalistic studies document the behavior of people or animals in their natural setting. For example, Jane Goodall recorded the behavior of chimpanzees in Tanzania for long periods of time. Surveys are used to ask large numbers of people questions about their characteristics, attitudes, beliefs, and activities. When surveys are used to estimate the characteristics of a large group of people, it is important that the people who take survey are as representative of that larger group as possible. In the Darley and Batson study a correlational method was used to ask whether more religious people were more helpful. In this kind of study, the both variables are measured directly as they occur in participants. The researchers did not try to manipulate or change their participants’ religiosity – they just measured it and then used statistical analyses to see whether religiosity predicted helping.
:: Slide 15 – continued – :: :: Slide 16 :: One strength of correlational designs is that they can be used when you cannot practically or ethically manipulate the theorized causal variable. A limitation is that correlations cannot prove a causal relationship. If Darley and Batson HAD found religiosity predicted helping, does that mean religion makes people more helpful? Not necessarily! A third variable may have caused both. For example, maybe participants who were raised in small towns tended to be more religious, but also to be more helpful. In contrast, experimental methods CAN be used to demonstrate causal relationships. The Darley and Batson study contained two experiments in one. Let’s focus on the Time Pressure variable as a example. A true experiment has several required features. First, researchers must manipulate the theorized causal variable, or “independent variable.” In the helping study, researchers told each participant whether or not he was under time pressure. Second, researchers must randomly assign participants to the different experimental conditions. In the helping study, the researchers could not allow participants to decide whether they were in a hurry or not, because people who are in a hurry naturally might differ in lots of ways from those who are not. :: Slide 16 – continued – :: :: Slide 16 – continued – :: Third, researchers “control” or hold constant every aspect of the situation other than the IV. Variables that differ between the conditions, but are not part of the hypothesis, are “confounds.” Confounds can cause differences in the DV that have nothing to do with the independent variable. For example, if most of the participants in the “Late” condition had been tested in the morning, and those in the “Early” condition were tested in the afternoon, it might be that people are more helpful in the afternoon than in the morning and time pressure has nothing to do with it. Fortunately this was not a problem in Darley and Batson’s study. Fourth, researchers measure the theorized effect, or “dependent variable.” In the helping study researchers measured the amount of help offered to the victim by each participant. Experimental methods have limitations. Because researchers must control so many aspects of the situation, the situations can be somewhat artificial. Also, it is unethical or impossible to manipulate many independent variables that would be interesting to study. However, experiments are the only methods that can be used to support a strong claim of a cause-effect relationship between variables. :: Slide 17 :: :: Slide 18 :: LO5: Compare and contrast cross-sectional versus longitudinal methods for studying change in psychological processes over time. In addition to these three methods, special methods are needed when researchers want to study how psychological processes develop or change over time. For example, what happens to people’s reasoning skills as they age? What kind of study could answer this question? Cross-sectional methods take a “slice” across different ages at the same point in time. For example, you could do IQ tests for people who are now in their 20s, 30s, 40s, and so on. Such studies typically find that reasoning skills drop with increasing age. Cross-sectional methods have the advantages of being relatively easy and inexpensive, and of controlling for historical events. However, participants in each age group come from different cohorts who grew up in different eras. Maybe education has been improving over the last century in ways that improve each new cohort’s performance on IQ tests, but the intelligence of individual people remains stable over time.
:: Slide 18 – continued – :: :: Slide 19 :: Longitudinal methods gather data from the same set of people over a long period of time. Longitudinal studies find that reasoning skills stays stable into the 60s, and even then drop only slightly. Cohort effects are not a problem in longitudinal methods, but these studies are difficult and expensive, and apparent effects of time/age may be due to historical events that had nothing to do with age. The ideal design for studying change over time is mixed longitudinal design, in which multiple cohorts are studied longitudinally LO6: Define reliability and validity, and evaluate a specific operational measure of a variable with respect to these criteria. LO7: Differentiate the kind of information conveyed by descriptive versus inferential statistics in describing scientific data, and interpret the meaning of specific statistics (i.e., mean, correlation coefficient). Scientific studies use strict methods for systematically observing behavior. The result is a large amount of data. In order to explain the meaning of those data in terms of the theory being tested, researchers must do two things. They must evaluate the quality of the operational measures they used of each variable, in terms of reliability and validity. They must summarize the data using descriptive and inferential statistics. :: Slide 20 :: :: Slide 21 :: In designing a study to test a theory, researchers must find a concrete way to manipulate or measure the variables in that theory. This is called an “operational measure.” For example, Darley and Batson operationalized “helping” in their study by how much effort each participant put into helping the man coughing in the doorway. In reporting a study, researchers must give evidence that their operational measures can be trusted. Evidence must document the reliability and validity of the measures. Reliability is the extent to which an operational measure is consistent across time and/or observers. If you stepped on a bathroom scale and it gave you one number, and five minutes later it gave you a very different number, you would not trust it – it would be unreliable. The same is true of a test or questionnaire. Researchers need to demonstrate that the same or similar measure, given to the same person under the same or similar conditions, would produce the same result. When human observations are used this means showing that different observers reach the same conclusions about what they see. What evidence should Darley and Batson have provided for the reliability of their helping measure? (Note: they did not document inter-rater reliability; only the “victim” rated helping). :: Slide 22 :: :: Slide 23 :: Validity is the extent to which an operational measure captures the underlying concept that it is supposed to measure. This can involve invoking the obvious meaning of the measure, or “face validity,” showing that the measure correlates with other measures of the same concept, or “construct validity,” and/or showing that the measure predicts relevant outcomes, or “predictive validity.” Just focusing on face validity, how valid do you think stopping to help a coughing person is as a measure of helpfulness? What other evidence of validity could the researchers have provided? Once researchers have collected their data, they must analyze the data. You have often heard of “statistics” that are used to summarize study data. However, there are two very different kinds of statistics, and both are needed in order to draw conclusions from a study. Descriptive statistics summarize the data that were actually collected in a study, including the central tendency and distribution of each variable, and how strongly variables are related to each other. Inferential statistics are used to extend conclusions based on actual study data to larger populations that were not included in the study. Specifically, inferential statistics assess the probability that the sample of people studied were somehow different from the larger population, just by chance.
:: Slide 24 :: :: Slide 25 :: Descriptive statistics simply summarize each variable, and the relationships between variables, as they are observed in the actual study data. For each variable, we are interested in the central tendency or “typical” score. The mean – the mathematical average of all scores on that variable - is the most commonly reported measure of central tendency. The median is the “halfway point” between the upper and lower half of scores, and the mode is the most common value or score. In the Darley and Batson study, mean helping was about 1.8 on the 0-5 scale. We are also interested in the distribution of scores for each measure, or variability – how much did people differ from each other? The most common measure of variability is the standard deviation. In a typical or “normal” distribution of scores, about 2/3 of scores will fall within one standard deviation of the mean. Descriptive statistics can also represent the relationship between two variables in the study data. For example, the correlation coefficient is a number between -1.00 and +1.00 that indicates how strongly two variables are associated; zero means no association, and more extreme values mean a strong association. In this graph, the correlation coefficient is +.XX, indicating that high school GPA is positively associated with Math SAT scores. Not enough info is provided about the source to get the actual correlation coefficient in this graph :: Slide 26 :: :: Slide 27 :: Descriptive statistics only tell us what is happening in the people researchers actually studied. However, the goal is to draw conclusions about wider populations of people. Inferential statistics estimate the probability that the sample of people in the study differs in important ways from the larger population of interest. When researchers collect a sample of people to study they are trusting to luck that they represent the population well, but they can never be sure. “Statistical significance” refers to the probability that apparent relationships between variables, observed in the study data, were only the result of sampling error and are NOT true in the population. In the Darley and Batson study this probability was less than 5% for the association between Time Pressure and Helping, so researchers trust that the association is probably real. LO8: Evaluate specific psychology studies in terms of the ethical guidelines for using human and animal participants in research. Before doing a study at all, researchers must show that it will not cause harm to the participants – whether those participants are humans or non-human animals. :: Slide 28 :: :: Slide 29 :: Incentives must be reasonable for the time and effort of participation, not coercive. Informed consent must be obtained, so participants know what they are agreeing to. If participants must be deceived for the study to work, they should be informed of the deception after the study in a “debriefing.” Steps must be taken to minimize any harm to participants, and any possible harm must be justified on the basis of the value of the research. Researchers must also guarantee the confidentiality of study information. Discuss possible ethical dilemmas arising from the Darley & Batson helping study, and ways to resolve. Research must offer a clear long-term benefit to humans or other animals. Animals must receive high-quality care, including housing, food, and veterinary treatment. All possible steps must be taken to minimize the animals’ pain and suffering.