Download
1 / 9
90 likes | 198 Views
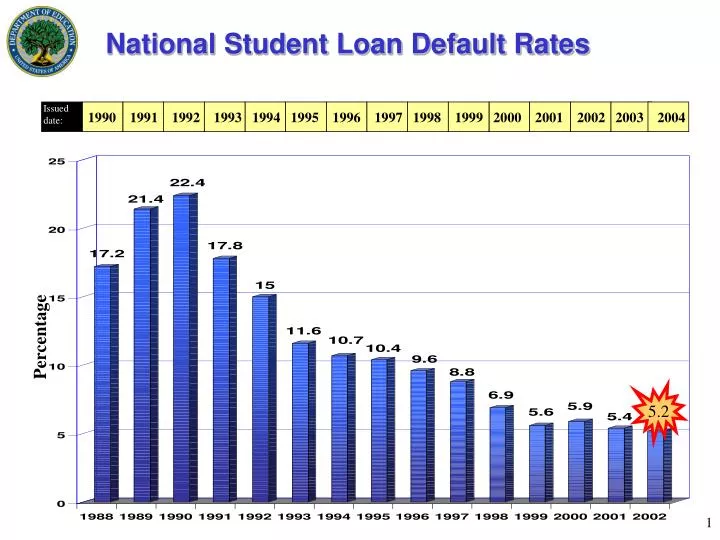
National Student Loan Default Rates. Issued date:. 1990 1991 1992 1993 1994 1995 1996 1997 1998 1999 2000 2001 2002 2003 2004. Percentage. 5.2. Schools Subject to Sanctions. Issued date:.

E N D
National Student Loan Default Rates Issued date: 1990 1991 1992 1993 1994 1995 1996 1997 1998 1999 2000 2001 2002 2003 2004 Percentage 5.2
Schools Subject to Sanctions Issued date: 1993 1994 1995 1996 1997 1998 1999 2000 2001 2002 2003 2004 Number of Schools The school numbers are pre-appeal and include only schools impacted by the three years of 25% or greater sanction. A school can be on extended sanction and is therefore reflected in multiple year counts. Since 1991, 1,161 unique schools were sanctioned under the three years of 25% or greater sanction.
Improving Borrower Accountability Communication • Increased Borrower Contacts • Conference Sessions on Default Reduction Technical Assistance • Cohort Default Rate Guide • On-site School Visits • National Handbook of Best Practices • FSA Assessments • Sample Default Management Plan Risk Analysis and Assessment • Data Mining and Portfolio Analysis • Portfolio Risk Management Group Aversion Tools • Improved Entrance/Exit Counseling • Flexible Repayment Options • Customized Repayment Plans • Electronic Billing and Payment • Late Stage Delinquency Assistance Program Integrity • Strategic Identification and Intervention Schools Lenders/Servicers Guaranty Agencies Department of Education Improved Borrower Accountability
Improving Program Integrity FSA School GA Lender
Federal Family Education Loan and Federal Direct Loan Cohort Default Rates Institutional Default Rate Reduction Initiative Comparison of FY 2000, FY 2001, and FY 2002 Cohort Default Rates
FSA Overview Scope of Operations – Fiscal Year 2003 • 13 million aid applications • 9 million aid recipients • $62 billion delivered in total new federal aid • $42 billion delivered in consolidation loans • 34 million inbound and outbound customer service phone calls • 25 million Direct Loan borrower payments processed • 20 billion hits to FSA Web sites • 41+ million pieces of mail alone sent out to aid applicants during the most recent annual cycle
FSA Overview Current Student Loan Portfolio • 24 million borrowers with outstanding loans • $342 billion in outstanding loans Includes: • Direct Loans held by ED • Federal Family Education Loan Program (FFELP) loans held by lenders • Defaulted FFELP loans held by guaranty agencies (GAs) • Defaulted loans (all programs) held by ED • Perkins Loans held by schools
Programs and Statistics $8B $34B $53B $147B FFELP FFELP Consolidation Direct Loans $100B Direct Loan Consolidation $342 Billion Perkins Total Federal Student Loan Portfolio 10
Programs and Statistics Distribution of Aid Types -Fiscal Year 2003 2% 24% 24% * Excludes Consolidation Loans 74%